Is Envista Holdings (NVST) Pricing Reflect Its Recent Share Price Recovery And Cash Flow Outlook
Envista Holdings NVST | 25.81 | -0.35% |
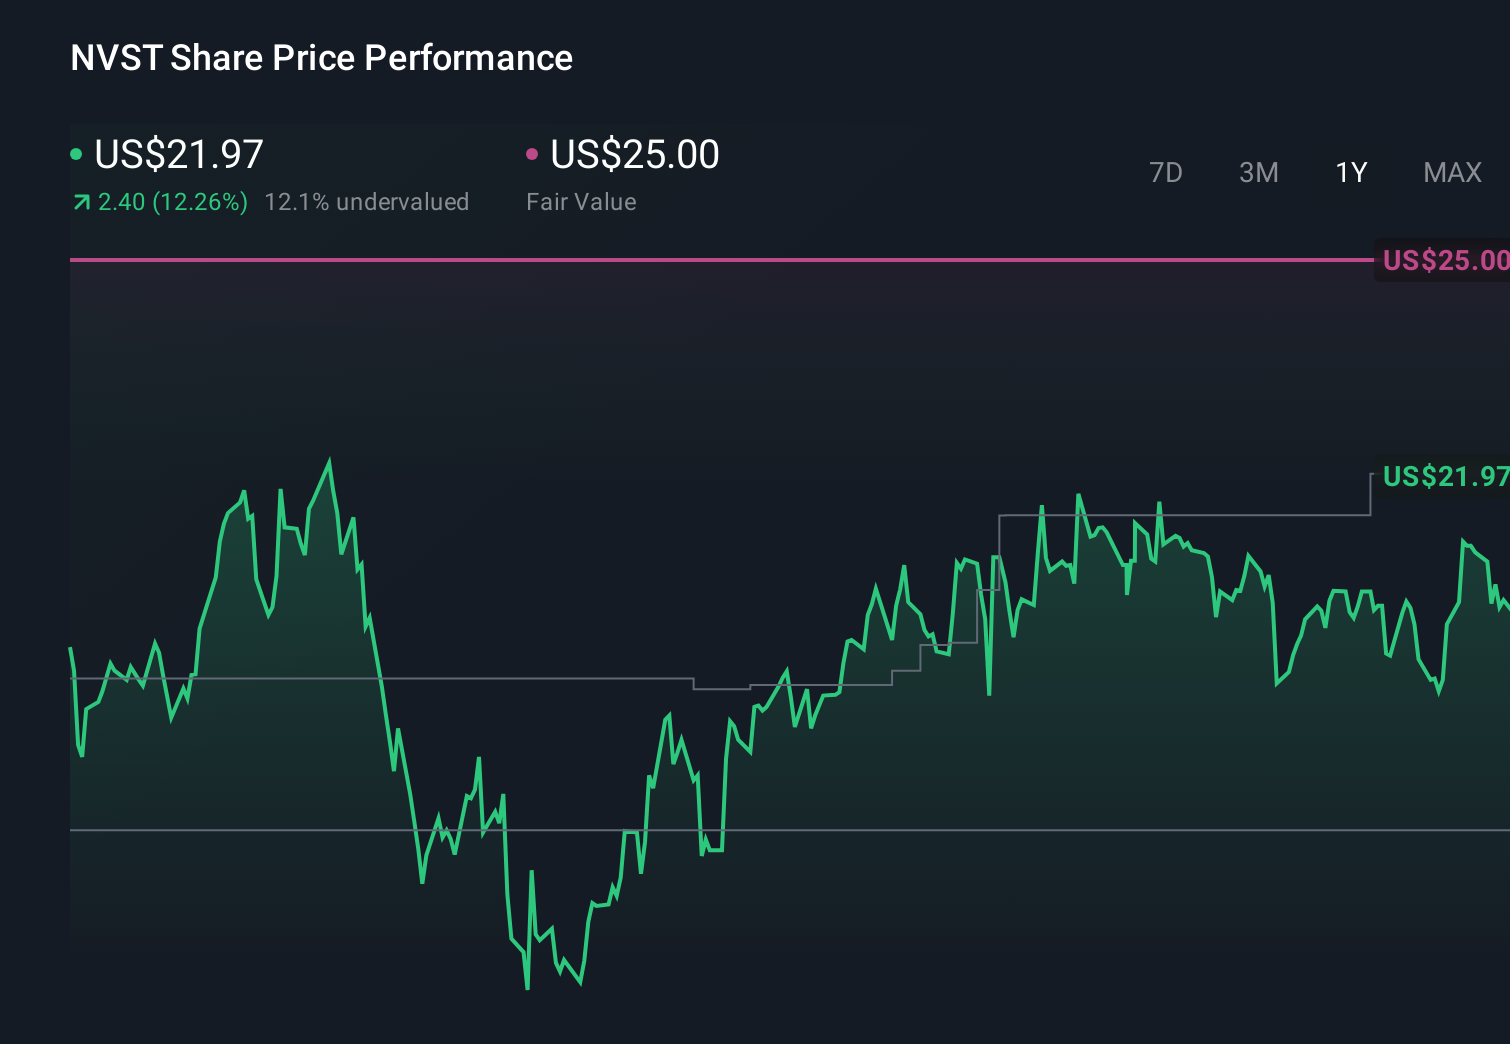
- If you are wondering whether Envista Holdings is offering good value at its recent price of US$24.67, it helps to look past the headlines and focus on what the numbers are really saying.
- The stock has returned 1.9% over the last 7 days, 9.9% over the last month, 13.7% year to date and 17.2% over the last year, while the 3 year and 5 year returns of 34.5% and 30.3% declines suggest a mixed longer term picture.
- These moves have come as Envista continues to attract attention within the dental products space, where investors often weigh defensive healthcare exposure against company specific execution and competition. While short term price swings can be driven by sentiment, they can also reflect how the market is constantly reassessing what the business might be worth.
- Simply Wall St currently gives Envista a valuation score of 5 out of 6. This suggests several of its valuation checks point to potential undervaluation. Next, we will look at how different methods arrive at that view and why there may be an even more useful way to think about value later in the article.
Approach 1: Envista Holdings Discounted Cash Flow (DCF) Analysis
A Discounted Cash Flow, or DCF, model takes projections of a company’s future cash flows and discounts them back to today using a required rate of return. This provides an estimate of what the whole business could be worth in dollars today.
For Envista Holdings, the model used is a 2 Stage Free Cash Flow to Equity approach. The latest twelve month free cash flow is about $253.05 million. Analysts provide forecasts out to 2028, with Simply Wall St extending those projections further, including an estimated free cash flow of $406.24 million in 2035. All of these future cash flows, such as the discounted $233.25 million for 2026 and $240.50 million for 2028, are brought back to today’s value within the model.
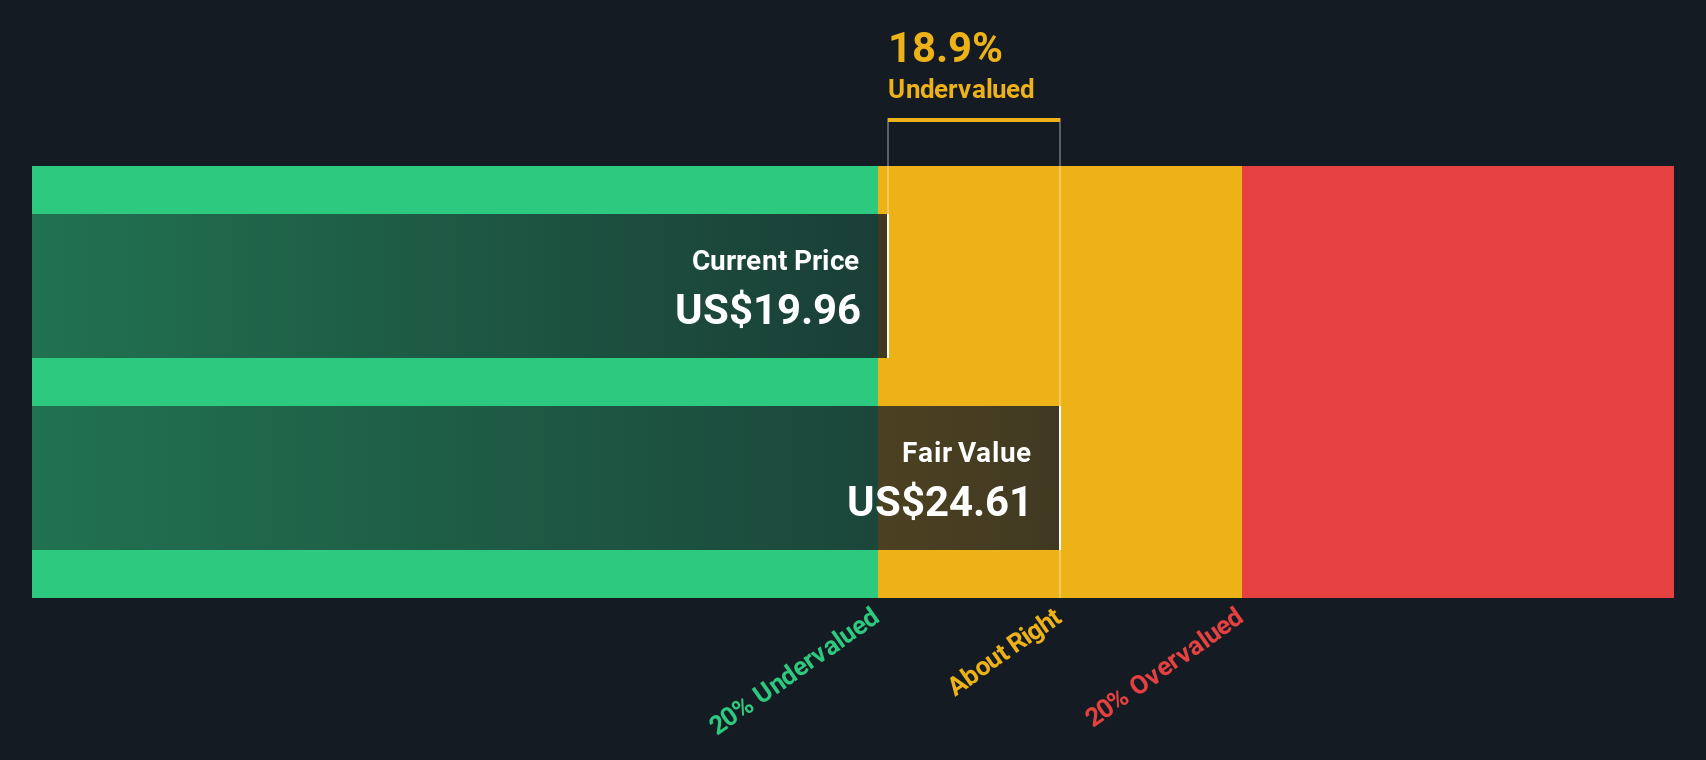
Based on this model, the DCF analysis arrives at an estimated intrinsic value of US$34.34 per share. Compared with the recent share price of US$24.67, this suggests an intrinsic discount of about 28.2%, meaning Envista is trading at a lower price than the model’s estimate of its cash flow based value.
Result: UNDERVALUED
Our Discounted Cash Flow (DCF) analysis suggests Envista Holdings is undervalued by 28.2%. Track this in your watchlist or portfolio, or discover 883 more undervalued stocks based on cash flows.
Approach 2: Envista Holdings Price vs Sales
For companies that are generating revenue but may have earnings that are less stable, the P/S ratio is a useful way to think about value because it compares what you pay for each dollar of sales rather than each dollar of profit.
In general, higher growth expectations or lower perceived risk can justify a higher “normal” P/S ratio, while slower growth or higher risk can point to a lower one. It therefore helps to compare Envista’s current P/S with a few reference points.
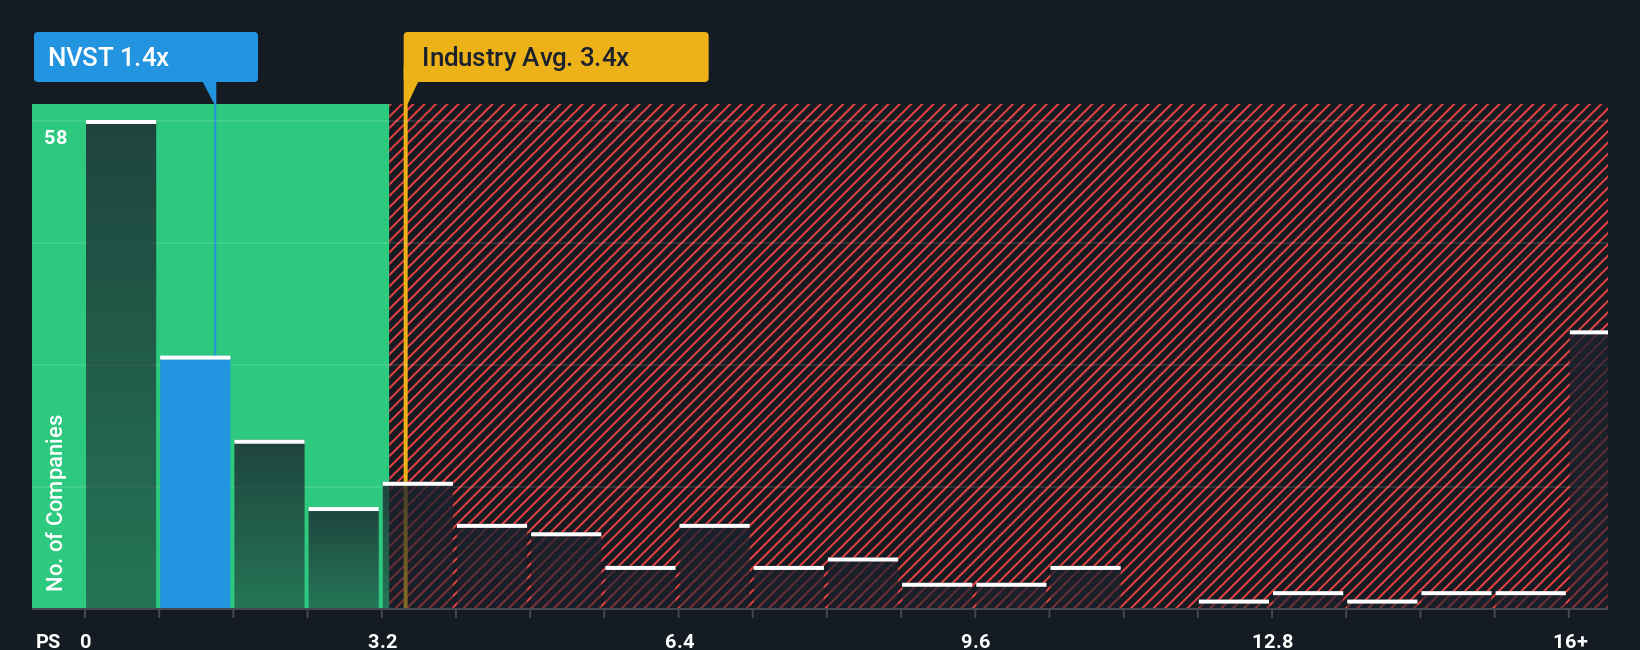
Envista is trading on a P/S of 1.55x. That sits below the Medical Equipment industry average P/S of 3.29x and also below the peer group average of 2.31x. Simply Wall St’s “Fair Ratio” for Envista is 1.84x, which is a proprietary view of what the P/S might be given factors such as growth profile, industry, profit margins, market cap and risk characteristics.
This Fair Ratio can be more informative than a simple comparison with peers or the broad industry because it is tailored to Envista’s own fundamentals rather than assuming similar companies all deserve the same multiple. With the current 1.55x P/S sitting below the 1.84x Fair Ratio, Envista screens as undervalued on this measure.
Result: UNDERVALUED
P/S ratios tell one story, but what if the real opportunity lies elsewhere? Discover 1447 companies where insiders are betting big on explosive growth.
Upgrade Your Decision Making: Choose your Envista Holdings Narrative
Earlier we mentioned that there is an even better way to understand valuation. Let us introduce you to Narratives, a simple tool on Simply Wall St’s Community page where you can connect your view of Envista’s story to your own forecast for its revenue, earnings, margins and fair value. You can then compare that fair value with the current share price to help decide whether the stock looks attractive or expensive. The Narrative automatically refreshes when new information like earnings or news arrives. One investor might build a Narrative that assumes Envista grows steadily with expanding margins and arrives at a higher fair value, while another might assume slower growth and more competitive pressure and reach a lower fair value. Both story-driven views are visible side by side on the platform used by millions of investors.
Do you think there's more to the story for Envista Holdings? Head over to our Community to see what others are saying!
This article by Simply Wall St is general in nature. We provide commentary based on historical data and analyst forecasts only using an unbiased methodology and our articles are not intended to be financial advice. It does not constitute a recommendation to buy or sell any stock, and does not take account of your objectives, or your financial situation. We aim to bring you long-term focused analysis driven by fundamental data. Note that our analysis may not factor in the latest price-sensitive company announcements or qualitative material. Simply Wall St has no position in any stocks mentioned.