Is Equity Residential (EQR) Trading Below Its Estimated Cash Flow And Earnings Value?
Equity Residential EQR | 60.27 | +1.21% |
- If you are wondering whether Equity Residential's current share price lines up with its real worth, you are not alone. This article will walk through what the numbers are saying about value.
- The stock recently closed at US$60.96, with returns of a 0.3% decline over 7 days, a 2.2% decline over 30 days, a 1.7% decline year to date and a 6.8% decline over 1 year, set against longer term returns of 10.9% over 3 years and 18.2% over 5 years.
- Recent attention on Equity Residential has been shaped by broader interest in listed residential landlords and investor focus on how public real estate vehicles compare with private market property values. These themes help frame how investors are thinking about risk, income resilience and what a fair price for the shares might look like.
- On Simply Wall St's 6 point valuation checklist, Equity Residential scores 5 out of 6. We will unpack this using several common valuation approaches before finishing with a perspective on a more complete way to think about valuation.
Approach 1: Equity Residential Discounted Cash Flow (DCF) Analysis
Approach 1: Equity Residential Discounted Cash Flow (DCF) Analysis
A DCF model takes the cash a business is expected to generate in the future, then discounts those cash flows back to today to estimate what the whole company might be worth. For Equity Residential, this is based on adjusted funds from operations using a 2 stage Free Cash Flow to Equity approach.
The latest twelve month free cash flow is about $1.47b. Analysts provide explicit forecasts out to 2028, with Simply Wall St extrapolating further to 2035. Those projections range from about $1.34b in 2026 up to about $1.91b in 2035, all stated in $ and then discounted back to today using the DCF model.
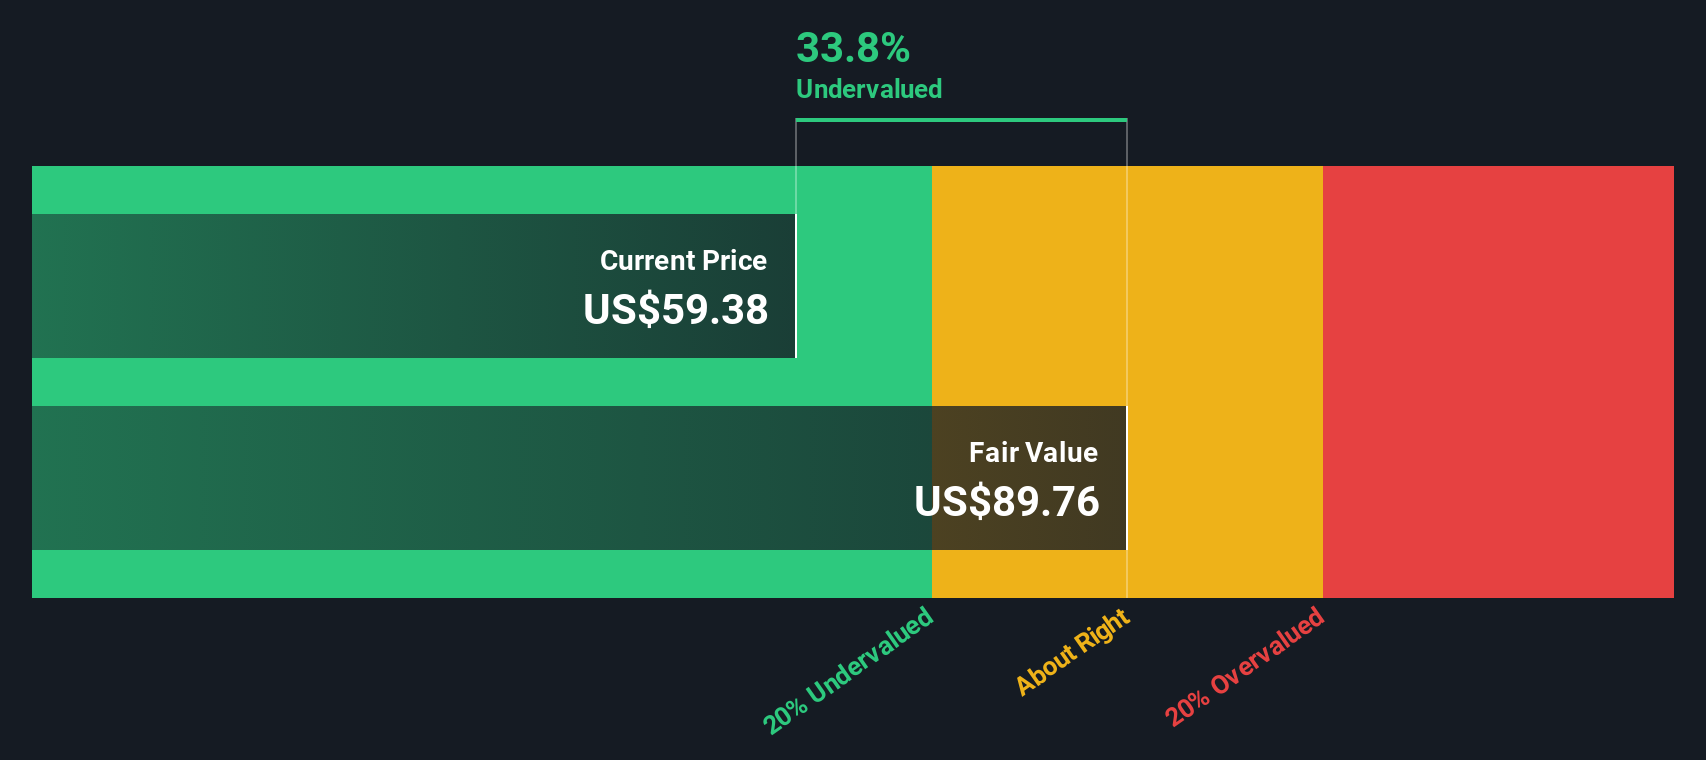
Adding those discounted cash flows together results in an estimated intrinsic value of about $91.97 per share. Compared with the recent share price of $60.96, the model implies Equity Residential trades at a 33.7% discount, which indicates that, on this cash flow framework, the shares appear undervalued.
Result: UNDERVALUED
Our Discounted Cash Flow (DCF) analysis suggests Equity Residential is undervalued by 33.7%. Track this in your watchlist or portfolio, or discover 876 more undervalued stocks based on cash flows.
Approach 2: Equity Residential Price vs Earnings
P/E is a useful check for a profitable company like Equity Residential because it ties what you are paying directly to the earnings that support dividends, debt service and reinvestment. Investors usually accept a higher or lower P/E depending on what they expect for earnings growth and how much risk they see in those earnings.
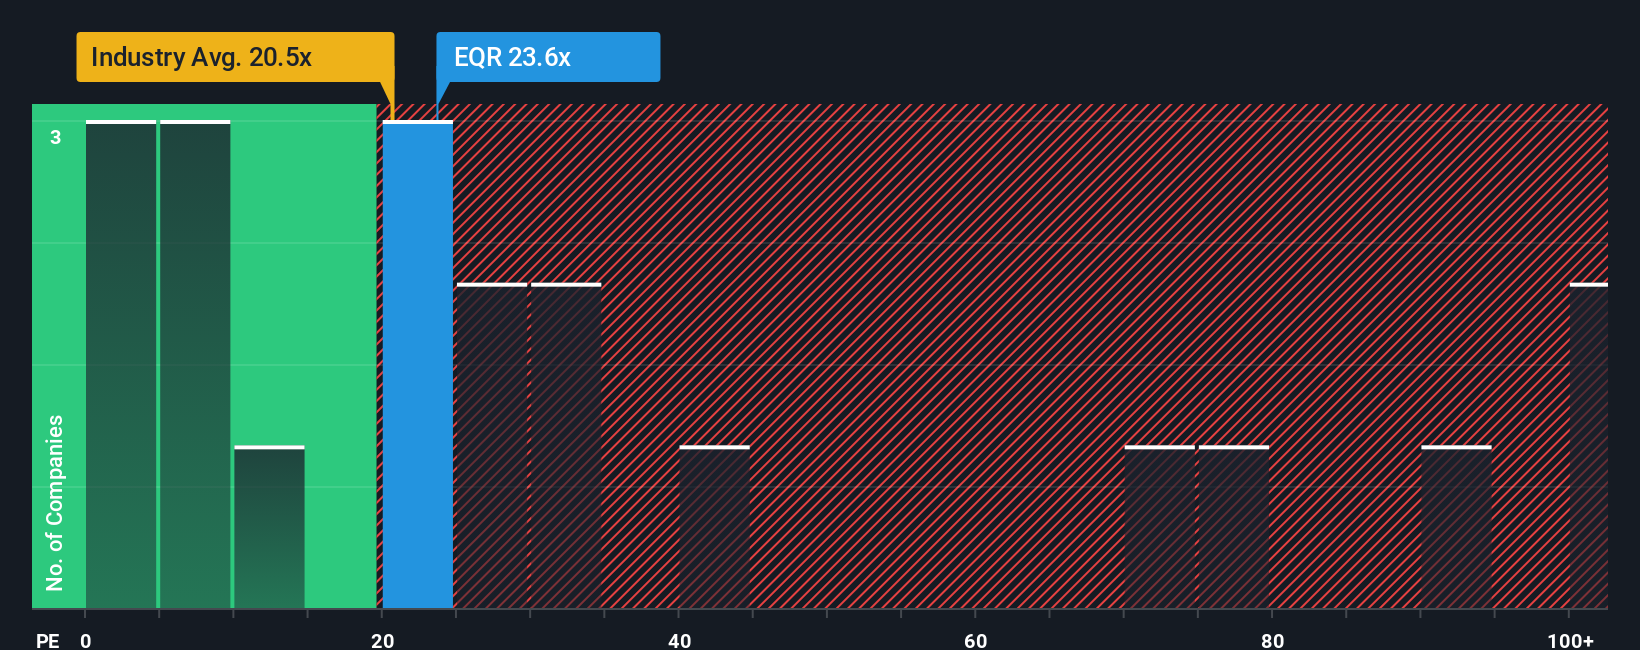
Equity Residential currently trades on a P/E of 20.1x, compared with the Residential REITs industry average of about 20.6x and a broader peer average of 38.7x. On the surface, that puts the shares roughly in line with the sector and below the peer group.
Simply Wall St’s Fair Ratio for Equity Residential is 25.0x. This is a proprietary estimate of what a reasonable P/E might be given the company’s earnings growth profile, industry, profit margins, market cap and key risks. Because it blends those company specific factors rather than just lining EQR up against high or low multiple peers, the Fair Ratio can be a more tailored yardstick than a simple industry or peer comparison.
With the current P/E of 20.1x sitting below the Fair Ratio of 25.0x, the shares appear undervalued on this earnings multiple view.
Result: UNDERVALUED
P/E ratios tell one story, but what if the real opportunity lies elsewhere? Discover 1431 companies where insiders are betting big on explosive growth.
Upgrade Your Decision Making: Choose your Equity Residential Narrative
Earlier we mentioned that there is an even better way to understand valuation, so let us introduce you to Narratives, which let you attach a clear story to your numbers by setting your own fair value, revenue, earnings and margin assumptions for Equity Residential.
A Narrative links three things in a straight line: the company’s story, the financial forecast that flows from that story, and the fair value that those forecasts support.
On Simply Wall St’s Community page, used by millions of investors, you can pick or create a Narrative for Equity Residential, then see how your Fair Value compares with the current share price to help you decide whether the stock looks expensive, cheap or roughly in line with your expectations.
Because Narratives update automatically when new information arrives, such as quarterly earnings or material news, your fair value view evolves without you needing to rebuild everything from scratch.
For example, one Equity Residential Narrative might assume a relatively conservative outlook and arrive at a fair value well below today’s price, while another, more optimistic Narrative might use stronger growth and margin assumptions and land on a fair value comfortably above the current market price.
Do you think there's more to the story for Equity Residential? Head over to our Community to see what others are saying!

This article by Simply Wall St is general in nature. We provide commentary based on historical data and analyst forecasts only using an unbiased methodology and our articles are not intended to be financial advice. It does not constitute a recommendation to buy or sell any stock, and does not take account of your objectives, or your financial situation. We aim to bring you long-term focused analysis driven by fundamental data. Note that our analysis may not factor in the latest price-sensitive company announcements or qualitative material. Simply Wall St has no position in any stocks mentioned.