Is FedEx (FDX) Still Reasonably Priced After Its Strong Share Price Run?
FedEx Corporation FDX | 380.88 | +4.37% |
- If you are wondering whether FedEx is still reasonably priced after a strong run, this article walks through what the current share price could mean for long term investors.
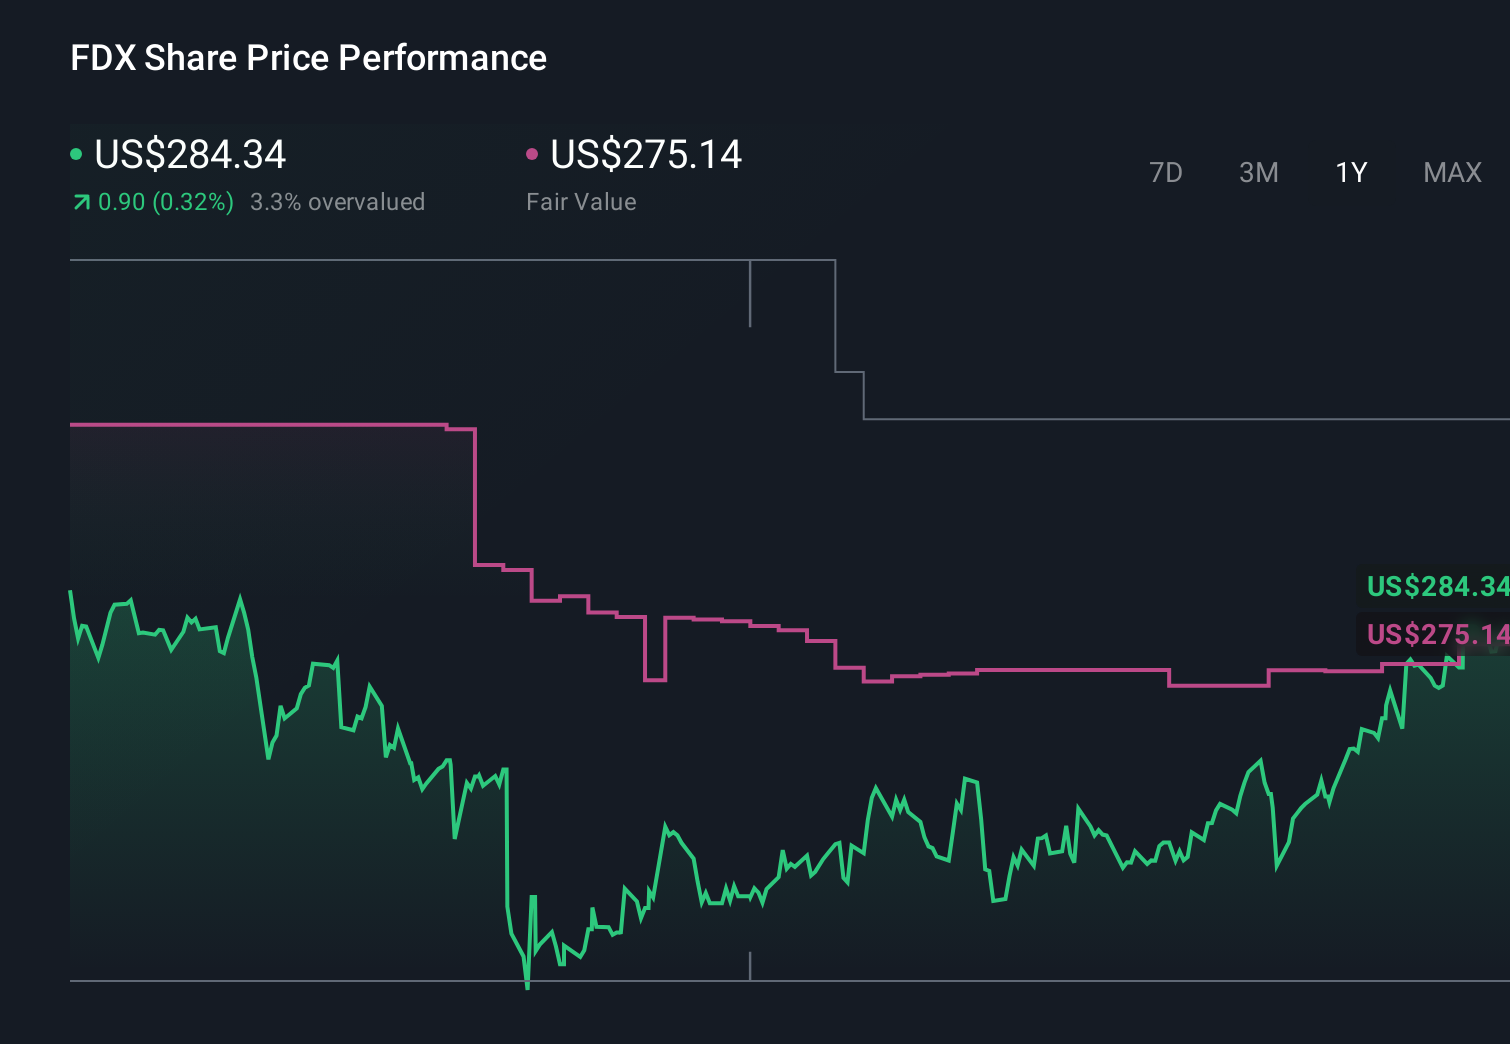
- FedEx shares most recently closed at US$369.46, with total returns of 1.5% over 7 days, 19.3% over 30 days, 26.0% year to date, 43.7% over 1 year, 86.2% over 3 years and 59.1% over 5 years, which has naturally raised fresh questions about value and risk.
- Recent FedEx headlines have focused on the company within broader discussions about parcel volumes, global trade flows and competition in express delivery, which help frame how the market is thinking about its prospects and risk profile. These themes provide useful context when you are deciding whether the current price fairly reflects the business or not.
- On Simply Wall St's valuation checks, FedEx has a value score of 3 out of 6. Next we will look at how different valuation approaches arrive at that figure, before finishing with a way to assess value that goes beyond the usual ratios and models.
Approach 1: FedEx Discounted Cash Flow (DCF) Analysis
A Discounted Cash Flow, or DCF, model estimates what a company could be worth by projecting its future cash flows and then discounting those back to today using a required rate of return.
For FedEx, the model used is a 2 Stage Free Cash Flow to Equity approach, based on cash flows in $. The latest twelve month free cash flow is about $3.57b. Analyst based projections are provided out to 2028, with Simply Wall St extrapolating further to build a ten year path of free cash flows, reaching a projected $7.12b in 2035.
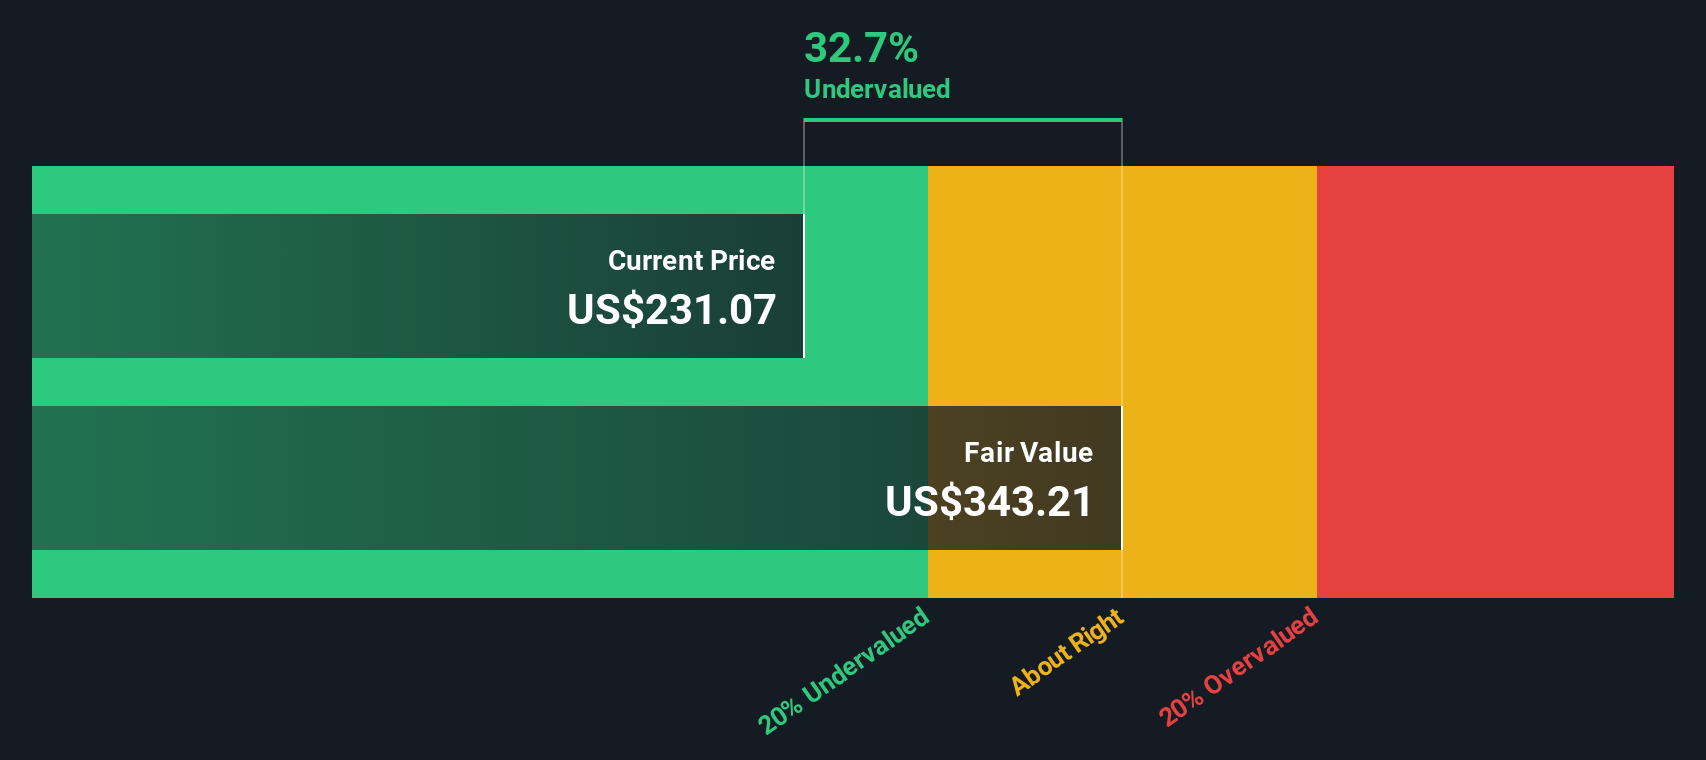
When those projected cash flows are discounted back to today, the model arrives at an estimated intrinsic value of US$405.56 per share. Compared with the recent share price of US$369.46, this implies the stock is trading at roughly an 8.9% discount to that DCF estimate, which is a fairly small gap.
Result: ABOUT RIGHT
FedEx is fairly valued according to our Discounted Cash Flow (DCF), but this can change at a moment's notice. Track the value in your watchlist or portfolio and be alerted on when to act.
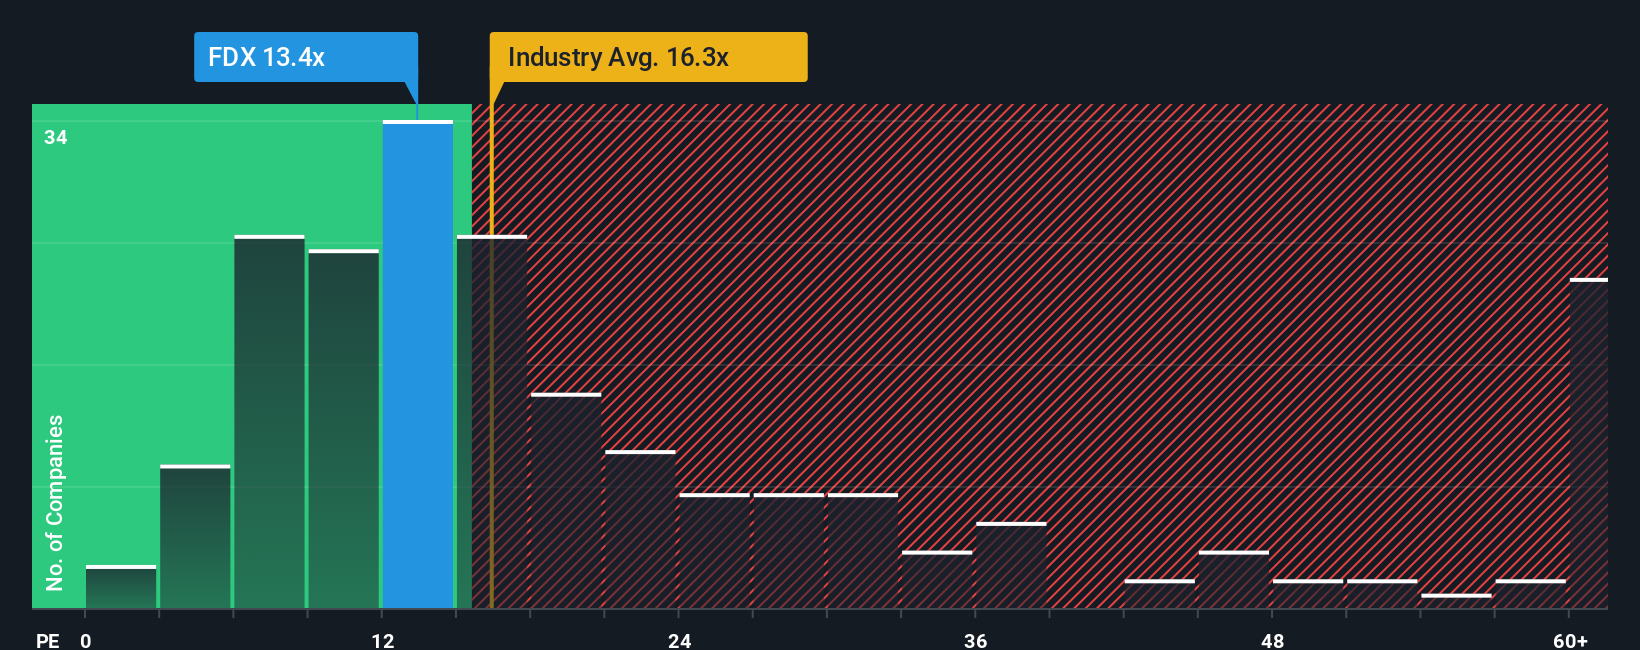
Approach 2: FedEx Price vs Earnings
For a profitable company like FedEx, the P/E ratio is a useful way to gauge what you are paying for each dollar of earnings. It reflects not just today’s profits but what investors collectively expect for future growth and how much risk they are willing to accept.
Higher growth expectations and lower perceived risk tend to justify a higher P/E, while slower expected growth or higher risk usually correspond to a lower, more cautious multiple. FedEx currently trades on a P/E of 20.06x. That sits above the Logistics industry average of 16.67x, but below the peer group average of 22.18x.
Simply Wall St’s Fair Ratio for FedEx is 21.90x. This is a proprietary estimate of what a reasonable P/E could be, given factors such as earnings growth, profit margins, industry, market cap and company specific risks. Because it blends these elements into one figure, the Fair Ratio can give you a more tailored reference point than a simple comparison with broad industry or peer averages. Against this Fair Ratio, FedEx’s current P/E of 20.06x is somewhat lower, which points to the shares being mildly undervalued on this metric.
Result: UNDERVALUED
P/E ratios tell one story, but what if the real opportunity lies elsewhere? Start investing in legacies, not executives. Discover our 23 top founder-led companies.
Upgrade Your Decision Making: Choose your FedEx Narrative
Earlier we mentioned that there is an even better way to understand valuation, so let us introduce you to Narratives, which are simple stories you create about a company that tie your view of its future revenue, earnings and margins to a forecast and then to a Fair Value that you can compare with the current price.
On Simply Wall St, Narratives live on the Community page and give you an easy way to say what you think FedEx’s future looks like. You can plug in assumptions such as revenue growth, profit margins, discount rate and future P/E, and instantly see the Fair Value that drops out of that story.
For example, one FedEx Narrative uses a higher Fair Value of about US$365 with assumptions like revenue growth of roughly 5.72%, a profit margin near 5.25% and a future P/E of 18.69x. A more cautious Narrative points to a Fair Value around US$233.77 with revenue growth of 2.04%, a profit margin of 5.49% and a future P/E of 12.51x. By comparing those Fair Values with today’s share price you can decide whether you see FedEx closer to the higher or lower Narrative, knowing that your view can update over time as new earnings, news and guidance are reflected in fresh numbers.
Do you think there's more to the story for FedEx? Head over to our Community to see what others are saying!
This article by Simply Wall St is general in nature. We provide commentary based on historical data and analyst forecasts only using an unbiased methodology and our articles are not intended to be financial advice. It does not constitute a recommendation to buy or sell any stock, and does not take account of your objectives, or your financial situation. We aim to bring you long-term focused analysis driven by fundamental data. Note that our analysis may not factor in the latest price-sensitive company announcements or qualitative material. Simply Wall St has no position in any stocks mentioned.