Is G-III Apparel Group (GIII) Pricing Look Stretched After Strong Three Year Share Gains
G-III Apparel Group, Ltd. GIII | 28.00 | +1.23% |
- If you are wondering whether G-III Apparel Group is attractively priced today, you are not alone. This article is here to unpack what the current share price might be telling you about value.
- The stock last closed at US$30.15, with returns of 0.4% over the past 30 days, 2.2% year to date and an 87.4% gain across 3 years, while the 1 year return sits close to flat at a 0.2% decline.
- Recent news around G-III Apparel Group has focused on its position in the apparel and consumer durables space and how investors are assessing the company against peers and broader sector trends. That context helps explain why returns have been relatively muted over the past year, especially compared to the strong 3 year performance.
- On our valuation checks, G-III Apparel Group has a value score of 2 out of 6. This sets up a closer look at how different valuation methods line up today and hints at an even richer way to think about value that we will come back to at the end.
G-III Apparel Group scores just 2/6 on our valuation checks. See what other red flags we found in the full valuation breakdown.
Approach 1: G-III Apparel Group Discounted Cash Flow (DCF) Analysis
A Discounted Cash Flow, or DCF, model takes projected future cash flows and discounts them back to today to estimate what the business might be worth right now.
For G-III Apparel Group, the model used is a 2 Stage Free Cash Flow to Equity approach based on cash flow projections. The latest twelve month free cash flow sits at about $372.4 million. Analysts provide explicit free cash flow estimates up to 2027, with Simply Wall St extrapolating further to build a 10 year path.
Within those projections, free cash flow in 2026 is set at $74.1 million and for 2027 at $103.7 million. By 2035, the extrapolated free cash flow estimate is $52.7 million. All of these are then discounted back to today and combined to arrive at an estimated intrinsic value per share of about $18.59.
Against the recent share price of around $30.15, this DCF output implies the stock is about 62.2% overvalued on this model.
Result: OVERVALUED
Our Discounted Cash Flow (DCF) analysis suggests G-III Apparel Group may be overvalued by 62.2%. Discover 51 high quality undervalued stocks or create your own screener to find better value opportunities.
Approach 2: G-III Apparel Group Price vs Earnings
For a profitable business, the P/E ratio is a useful shorthand for how much investors are paying for each dollar of earnings. It ties directly to what the company is actually earning today, which makes it a practical sense check on the more detailed DCF work you saw above.
What counts as a “normal” P/E really depends on two things: how quickly earnings are expected to grow and how risky those earnings appear. Higher growth or lower perceived risk can support a higher P/E, while slower growth or higher risk tends to point to a lower P/E.
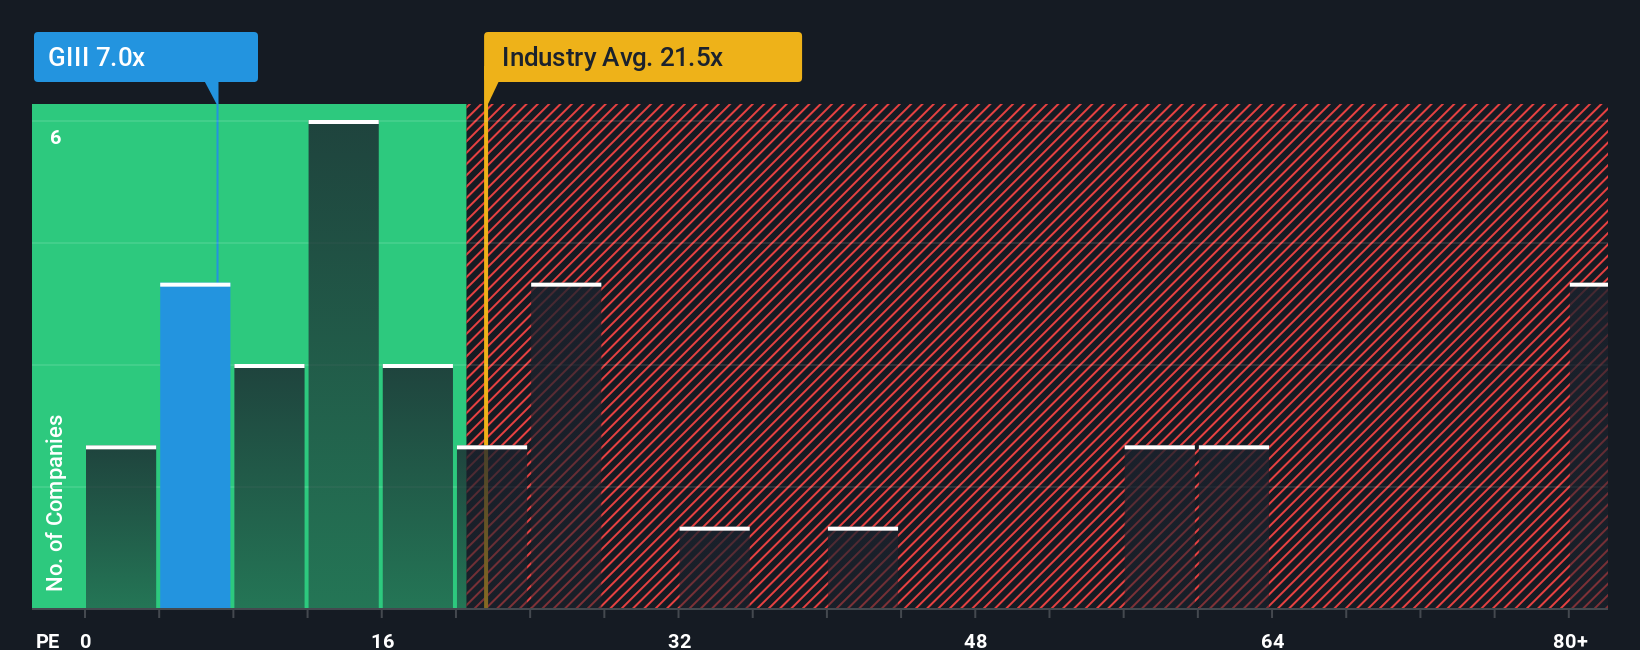
G-III Apparel Group is currently trading on a P/E of 8.59x. That sits well below the Luxury industry average of 18.91x and also below the broader peer group average of 35.55x. Simply Wall St goes a step further with its Fair Ratio, a proprietary estimate of what P/E might be appropriate for this specific company, based on factors like earnings growth, profit margins, industry, market cap and key risks.
This Fair Ratio framework can be more tailored than a simple peer or industry comparison because it adjusts for differences in growth profiles and risk levels rather than assuming all companies deserve the same multiple.
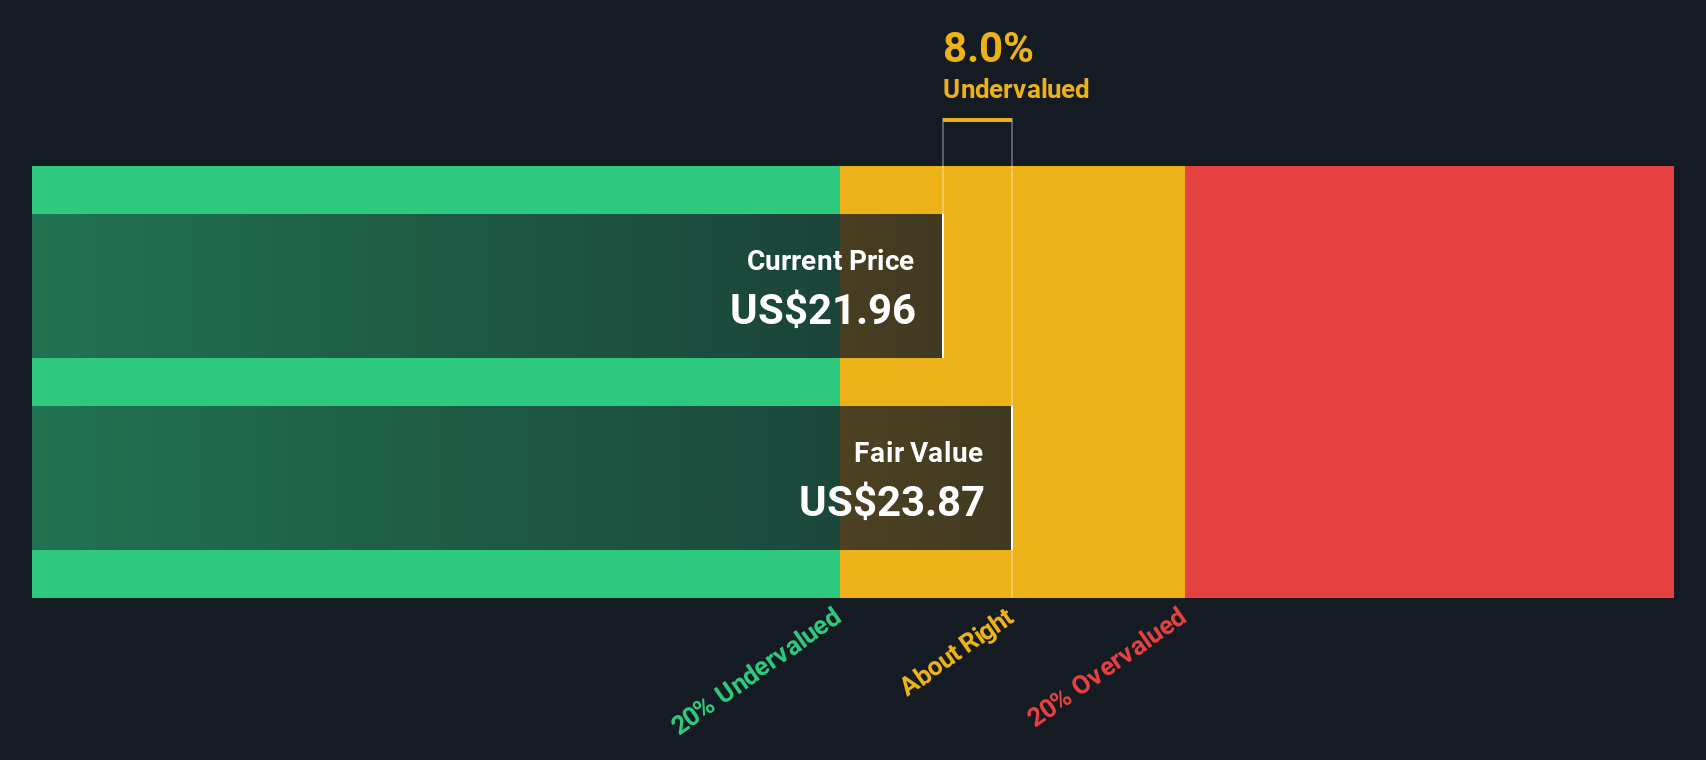
Result: UNDERVALUED
P/E ratios tell one story, but what if the real opportunity lies elsewhere? Start investing in legacies, not executives. Discover our 22 top founder-led companies.
Upgrade Your Decision Making: Choose your G-III Apparel Group Narrative
Earlier we mentioned that there is an even better way to understand valuation, so let us introduce you to Narratives, a simple tool on Simply Wall St's Community page that lets you connect your view of G-III Apparel Group’s story to a specific forecast for revenue, earnings and margins. You can then link that to a fair value that you can compare to the current share price. The Narrative is automatically refreshed as new earnings or news arrive. For example, one investor might side with the most bullish view that G-III Apparel Group could be worth US$36.00, while another might lean toward the most cautious view of US$27.00. Both perspectives can sit side by side as clear, number backed stories you can learn from and update over time.
Do you think there's more to the story for G-III Apparel Group? Head over to our Community to see what others are saying!

This article by Simply Wall St is general in nature. We provide commentary based on historical data and analyst forecasts only using an unbiased methodology and our articles are not intended to be financial advice. It does not constitute a recommendation to buy or sell any stock, and does not take account of your objectives, or your financial situation. We aim to bring you long-term focused analysis driven by fundamental data. Note that our analysis may not factor in the latest price-sensitive company announcements or qualitative material. Simply Wall St has no position in any stocks mentioned.