Is General Motors (GM) Offering Value After Its 60.7% One Year Share Price Gain
General Motors Company GM | 0.00 |
- If you are wondering whether General Motors at around US$79.40 represents genuine value or is mainly pricing in optimism, this article walks you through what the current numbers indicate.
- The stock has declined about 2.8% over the last week after gaining 5.5% over the past month. It remains up 60.7% over the last year and 119.2% over three years, with a more modest 33.9% gain over five years.
- Recent attention around General Motors has focused on its position in the broader auto industry and how investors are weighing long term prospects against shorter term share price moves. That mix of enthusiasm and caution helps explain why the stock can move sharply over weeks, while the multi year return profile looks very different.
- General Motors currently scores a 3/6 valuation check, which means it screens as undervalued on half of the tests used here. The next sections explain how different valuation approaches view the stock and why there may be an even better way to think about value by the end of this article.
Approach 1: General Motors Discounted Cash Flow (DCF) Analysis
A Discounted Cash Flow, or DCF, model estimates what a stock could be worth by projecting the company’s future cash flows and then discounting those cash flows back to today’s value.
For General Motors, the model used is a 2 Stage Free Cash Flow to Equity approach. The latest twelve month free cash flow stands at about $13.6b. Analyst projections feed into this model for the earlier years, and then Simply Wall St extends those forecasts further out. For example, free cash flow for 2026 is modeled at $10.1b and the projection for 2035 sits at $12.9b, with interim years gradually adjusting between those points.
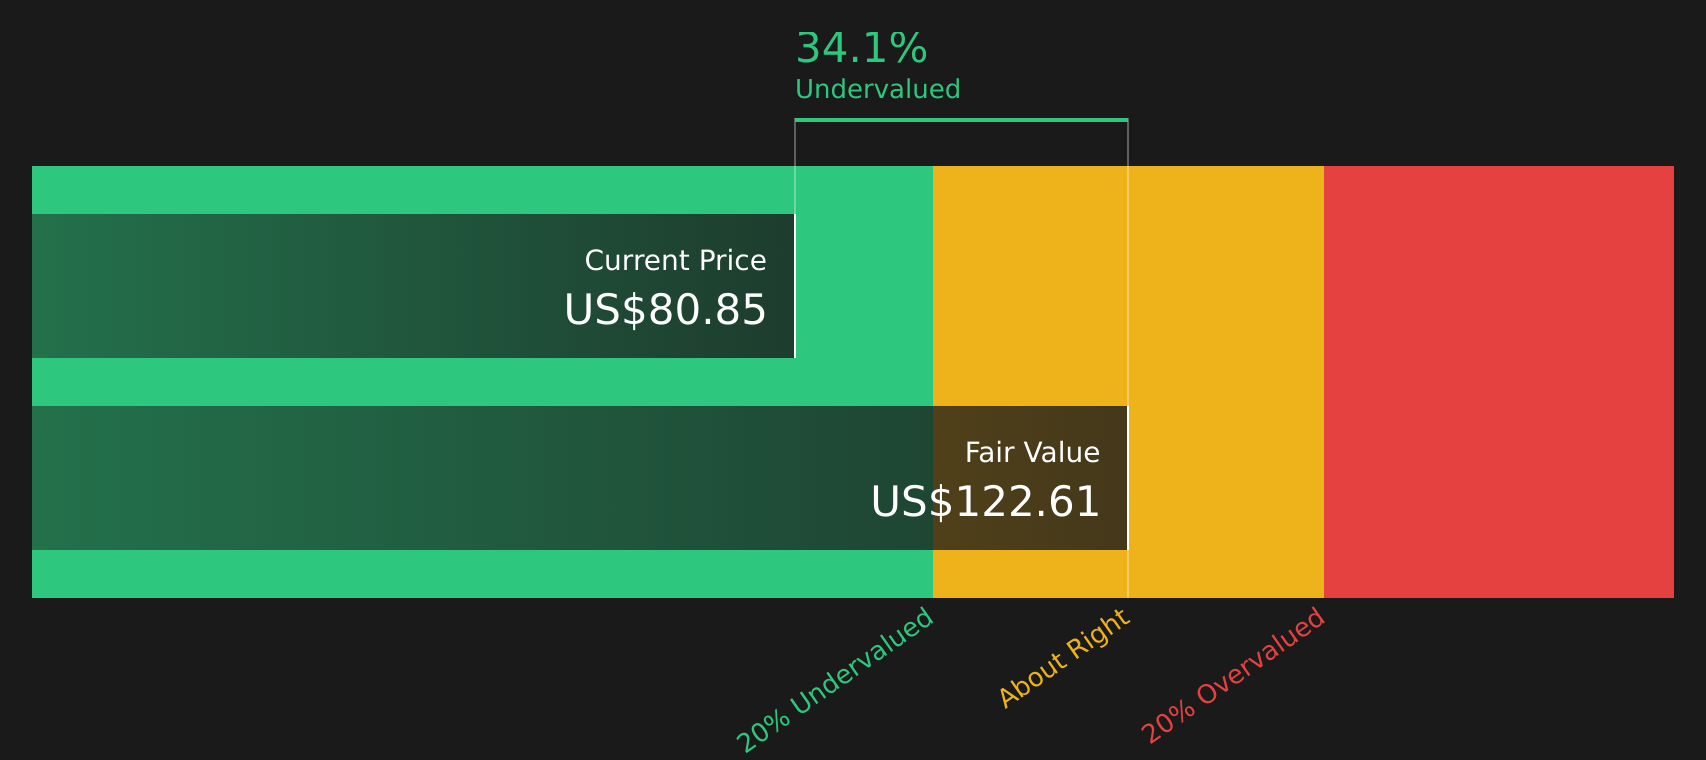
Bringing all of those projected cash flows back to today, the DCF model arrives at an estimated intrinsic value of $122.61 per share. Against a share price of around $79.40, that indicates the stock appears roughly 35.2% undervalued on this cash flow view.
Result: UNDERVALUED
Our Discounted Cash Flow (DCF) analysis suggests General Motors is undervalued by 35.2%. Track this in your watchlist or portfolio, or discover 47 more high quality undervalued stocks.
Approach 2: General Motors Price vs Earnings
For profitable companies, the P/E ratio is a useful way to think about value because it links what you pay per share to the earnings that each share currently generates. It is a quick check on how much the market is willing to pay for each dollar of profit.
What counts as a “normal” or “fair” P/E ratio usually reflects how the market views a company’s growth potential and risk. Higher expected growth or lower perceived risk can support a higher P/E, while slower growth or higher risk tends to point to a lower multiple.
General Motors is trading on a P/E of 29.43x. That is above the Auto industry average of 15.30x and also above the peer group average of 27.95x, so the stock currently carries a richer earnings multiple than these benchmarks. Simply Wall St’s Fair Ratio for General Motors is 31.13x. This Fair Ratio is a proprietary estimate of what the P/E could be, given factors such as earnings growth, industry, profit margin, market cap and company specific risks, which can make it a more tailored guide than a simple comparison with peers or the industry.
With the current P/E of 29.43x sitting below the Fair Ratio of 31.13x, the stock screens as slightly undervalued on this earnings multiple view.
Result: UNDERVALUED

P/E ratios tell one story, but what if the real opportunity lies elsewhere? Start investing in legacies, not executives. Discover our 19 top founder-led companies.
Upgrade Your Decision Making: Choose your General Motors Narrative
Earlier it was mentioned that there is an even better way to understand valuation. Narratives are introduced here as simple stories that you choose for General Motors by linking your view of its future revenue, earnings and margins to a Fair Value, then comparing that Fair Value with the current price so you can see whether your story suggests the stock is expensive or cheap. This is all provided within an easy tool on Simply Wall St’s Community page that updates automatically as new news or earnings arrive. It already includes very different perspectives, ranging from a more cautious Fair Value around US$67.00 to a more optimistic Fair Value around US$120.00, both built from explicit assumptions about GM’s truck reliance, EV execution and subscription revenue potential.
For General Motors, however, we will make it really easy for you with previews of two leading General Motors Narratives:
Fair value: US$94.81
Implied discount to this fair value: about 16.2% below that narrative fair value based on the recent price of US$79.40
Revenue growth assumption: 1.93% a year
- Analysts build this view around higher margin trucks, expanding EV models, and growing software and services that together are expected to lift revenue and margins over time.
- The narrative leans on GM’s manufacturing and battery investments, cost controls, and share buybacks to support earnings and earnings per share if those plans are delivered.
- Key risks in this story include tariff and trade costs, EV affordability and adoption, intense competition, and the ongoing cash demands of large capital and R&D programs.
Fair value: US$66.90
Implied premium to this fair value: about 18.7% above that narrative fair value based on the recent price of US$79.40
Revenue growth assumption: 1.04% a year
- This narrative focuses on GM’s costly transition from internal combustion to EVs, with trucks and SUVs still carrying most of the profit load while EV economics remain challenging.
- It highlights execution, legal, and regulatory risks around new technologies, product safety, and recalls, alongside the capital intensity of autonomy and software ambitions.
- On this view, GM is seen more as a complex capital allocation and risk management story, where modest growth expectations and transition costs cap the valuation that some investors may be willing to pay.
If you want to see how these bullish and bearish stories are built in full, and how other investors are framing the same numbers, you can step through the complete narratives and supporting assumptions directly on Simply Wall St, including the See what the community is saying about General Motors.
Do you think there's more to the story for General Motors? Head over to our Community to see what others are saying!

This article by Simply Wall St is general in nature. We provide commentary based on historical data and analyst forecasts only using an unbiased methodology and our articles are not intended to be financial advice. It does not constitute a recommendation to buy or sell any stock, and does not take account of your objectives, or your financial situation. We aim to bring you long-term focused analysis driven by fundamental data. Note that our analysis may not factor in the latest price-sensitive company announcements or qualitative material. Simply Wall St has no position in any stocks mentioned.