Is General Motors (GM) Still Attractive After Its Strong Multi Year Share Price Run?
General Motors Company GM | 72.54 | -3.33% |
- If you are wondering whether General Motors stock still offers value at current levels, you are not alone. This article focuses squarely on that question.
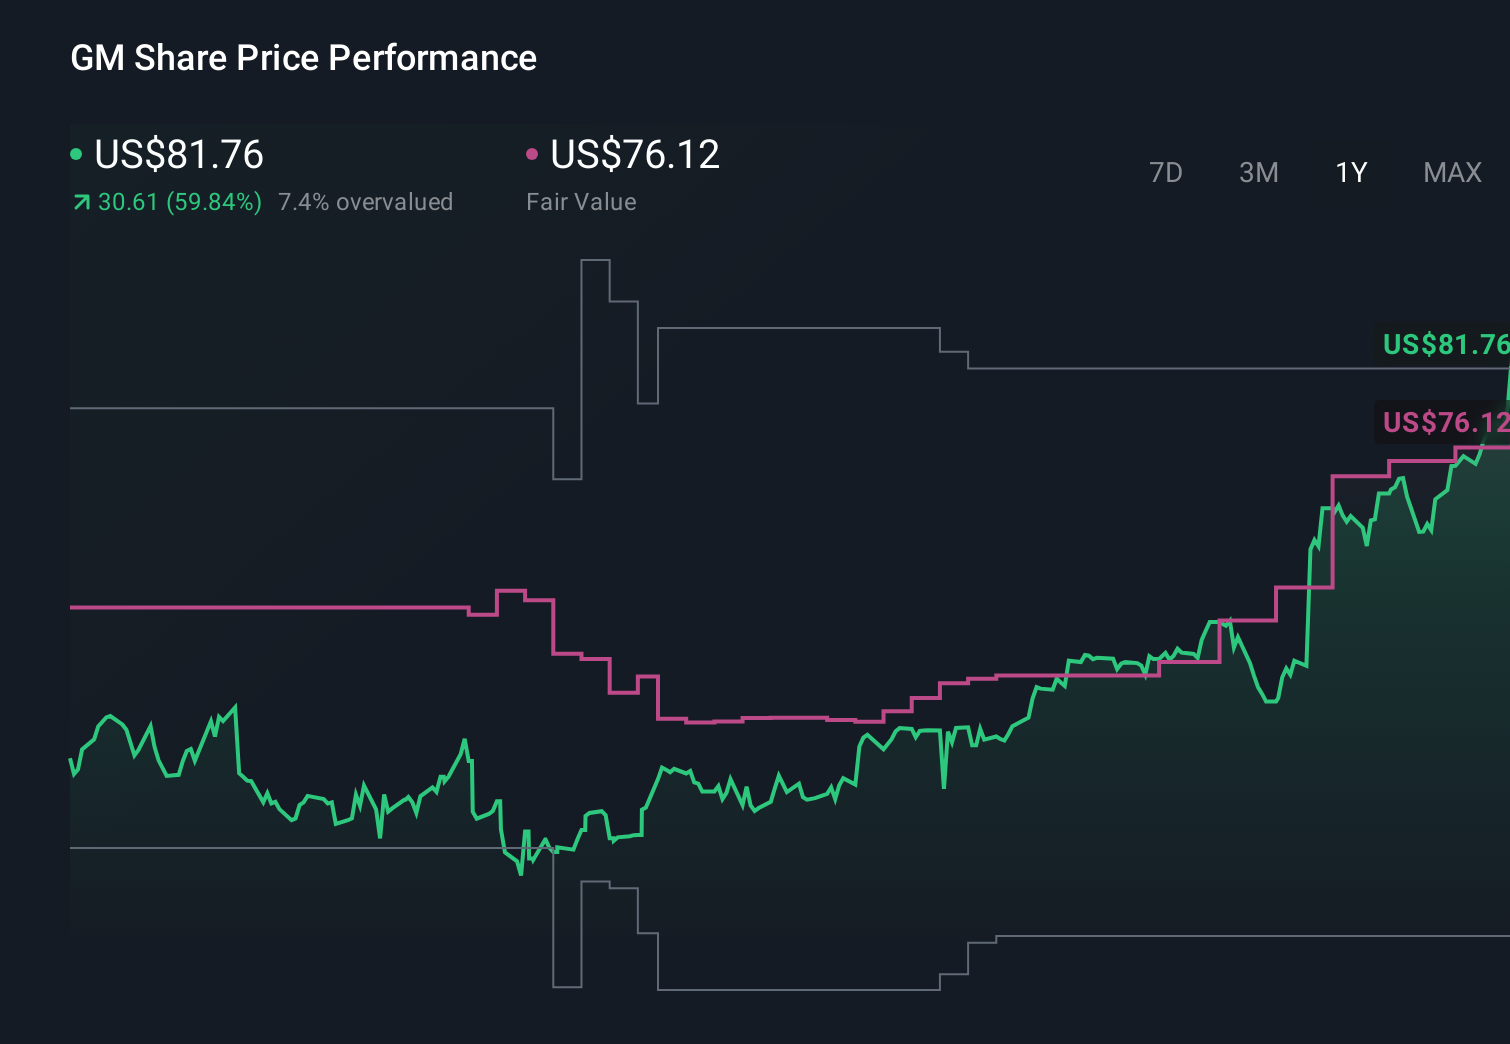
- GM shares last closed at US$85.13, with returns of 4.7% over 7 days, 10.3% over 30 days, 5.1% year to date, 68.7% over 1 year and 129.2% over 3 years, compared to 71.2% over 5 years.
- Recent headlines around General Motors have focused on its ongoing transition toward electric and software enabled vehicles, along with industry wide discussions about pricing power and capital spending. These themes form an important backdrop for how investors interpret the stock's recent performance and potential risks.
- On our checks, General Motors scores 4 out of 6 on valuation, as shown by its 4/6 value score. Next we will look at what different valuation methods say about that number, before finishing with a way to think about valuation that many investors find even more useful.
Approach 1: General Motors Discounted Cash Flow (DCF) Analysis
A Discounted Cash Flow, or DCF, model estimates what a company might be worth by projecting its future cash flows and discounting them back to today’s value using a required return.
For General Motors, the model used here is a 2 Stage Free Cash Flow to Equity approach, based on cash flow projections. The latest twelve month Free Cash Flow is about $13.4b. Analyst inputs cover the nearer years, and Simply Wall St extrapolates further out, with projected Free Cash Flow of $9.9b in 2030 and continued estimates through 2035.
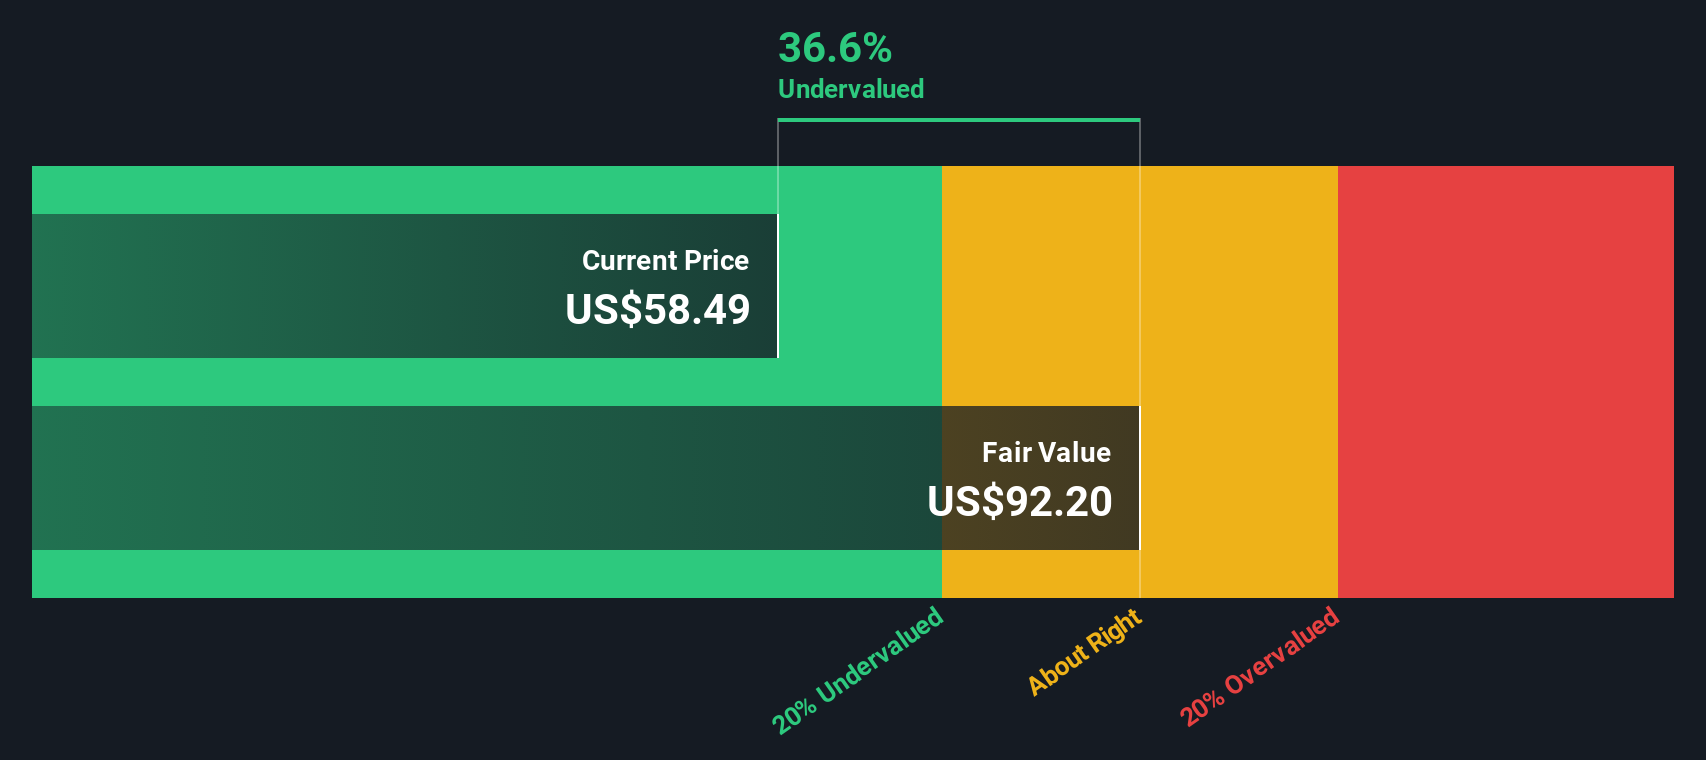
When all these projected cash flows are discounted back to today and added up, the model arrives at an estimated intrinsic value of about $100. Compared with the recent share price of US$85.13, the DCF suggests the stock trades at roughly a 14.9% discount, which indicates that it is undervalued according to this method.
Result: UNDERVALUED
Our Discounted Cash Flow (DCF) analysis suggests General Motors is undervalued by 14.9%. Track this in your watchlist or portfolio, or discover 881 more undervalued stocks based on cash flows.
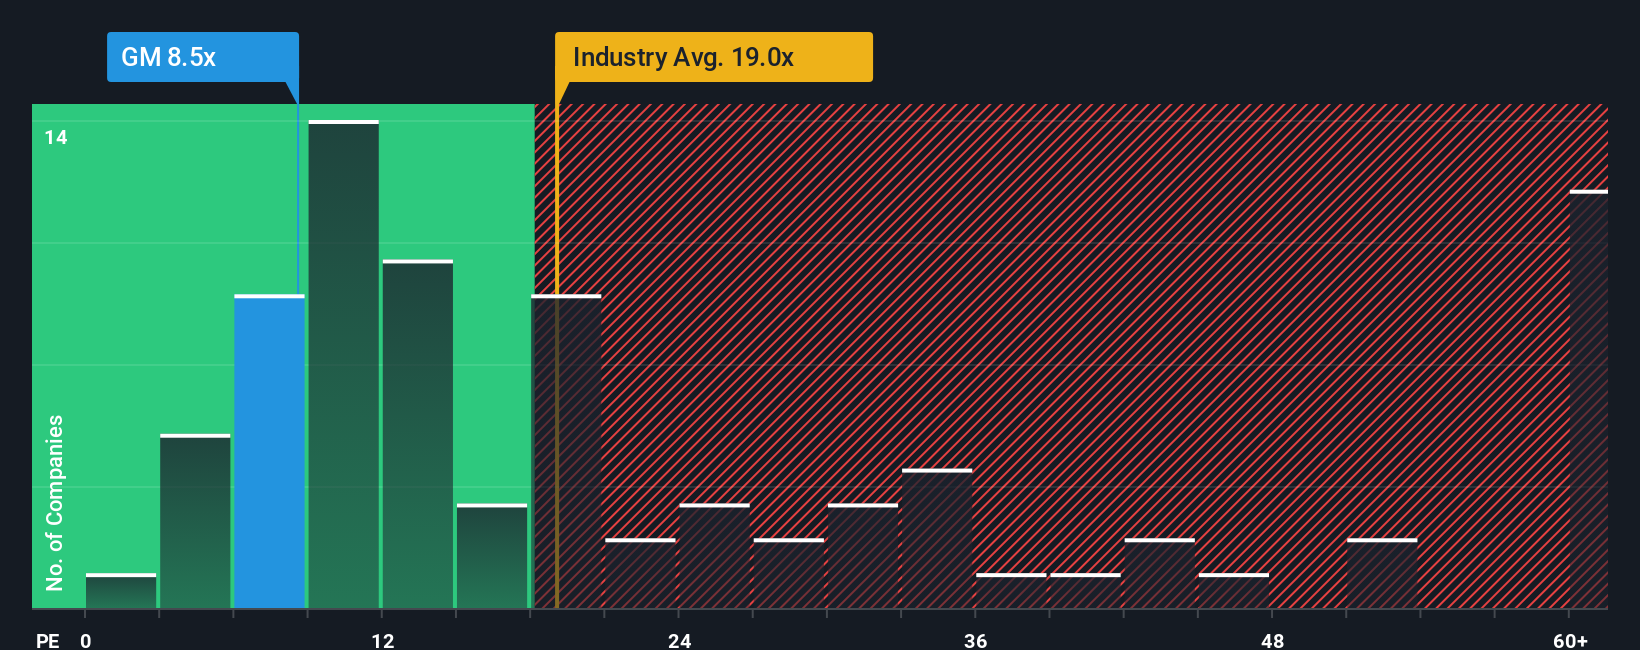
Approach 2: General Motors Price vs Earnings
For a profitable company like General Motors, the P/E ratio is a useful shorthand for what investors are currently willing to pay for each dollar of earnings. It links directly to return expectations, because a higher P/E usually means the market is paying up for perceived quality or growth potential, while a lower P/E can reflect more caution.
What counts as a “normal” P/E depends on growth expectations and risk. Faster earnings growth and more predictable cash flows typically support a higher multiple, while higher uncertainty or weaker profitability usually push it lower.
General Motors currently trades on a P/E of 16.68x. That is below the Auto industry average of 18.22x and also below the peer average of 22.94x. Simply Wall St’s Fair Ratio for General Motors is 20.76x. This is its proprietary view of what the P/E could be, given factors such as the company’s earnings profile, industry, profit margins, market capitalization and identified risks.
The Fair Ratio is more tailored than a simple industry or peer comparison, because it adjusts for company-specific characteristics rather than assuming all Auto stocks deserve the same multiple. With the current P/E of 16.68x below the Fair Ratio of 20.76x, this approach points to General Motors trading at a discount on earnings.
Result: UNDERVALUED
P/E ratios tell one story, but what if the real opportunity lies elsewhere? Discover 1445 companies where insiders are betting big on explosive growth.
Upgrade Your Decision Making: Choose your General Motors Narrative
Earlier we mentioned that there is an even better way to understand valuation. Narratives on Simply Wall St’s Community page give you a simple way to write your own story for General Motors, connect that story to your assumptions for future revenue, earnings and margins, convert those assumptions into a fair value, then compare that fair value with the current price to help you decide whether the stock fits your plan. Each Narrative updates automatically when new news or earnings arrive. One investor might build a cautiously priced GM view around a fair value near US$38, while another might focus on stronger profitability and software potential and anchor their Narrative closer to US$100, and both can clearly see how their different stories link to very different fair values.
Do you think there's more to the story for General Motors? Head over to our Community to see what others are saying!
This article by Simply Wall St is general in nature. We provide commentary based on historical data and analyst forecasts only using an unbiased methodology and our articles are not intended to be financial advice. It does not constitute a recommendation to buy or sell any stock, and does not take account of your objectives, or your financial situation. We aim to bring you long-term focused analysis driven by fundamental data. Note that our analysis may not factor in the latest price-sensitive company announcements or qualitative material. Simply Wall St has no position in any stocks mentioned.