Is Genpact (G) Now An Opportunity After Recent Share Price Weakness?
Genpact Limited G | 0.00 |
- If you are wondering whether Genpact at around US$34.48 is a bargain or a value trap, the key is understanding what the current price really reflects.
- Over the short term, the stock has seen a 0.8% decline over 7 days, an 8.0% decline over 30 days, and is down 24.9% year to date, with a 16.6% decline over 1 year and a near flat 0.3% return over 3 years, compared with a 17.0% decline over 5 years.
- Recent coverage around Genpact has focused on how the business is positioned in professional services and business process management. This helps explain why investors are reassessing expectations after a weaker share price run. This mix of long term positioning and softer recent returns sets the context for thinking carefully about what is already priced into the stock.
- On Simply Wall St's valuation checks, Genpact scores a 6 out of 6 valuation score. This sets up a closer look at how different valuation methods line up and points to an even richer way of understanding value that will be covered at the end of this article.
Approach 1: Genpact Discounted Cash Flow (DCF) Analysis
A Discounted Cash Flow, or DCF, model estimates what a stock could be worth by projecting future cash flows and then discounting them back to today using a required return. It is essentially asking what Genpact’s future cash generation is worth in today’s dollars.
Genpact’s latest twelve month Free Cash Flow is about $730.4 million. Analysts provide cash flow estimates for several years, and Simply Wall St extends these out further using its own assumptions. In this case, projected Free Cash Flow reaches an estimated $1,175.2 million in 2035, with each year’s cash flow discounted back to today using a 2 Stage Free Cash Flow to Equity model.
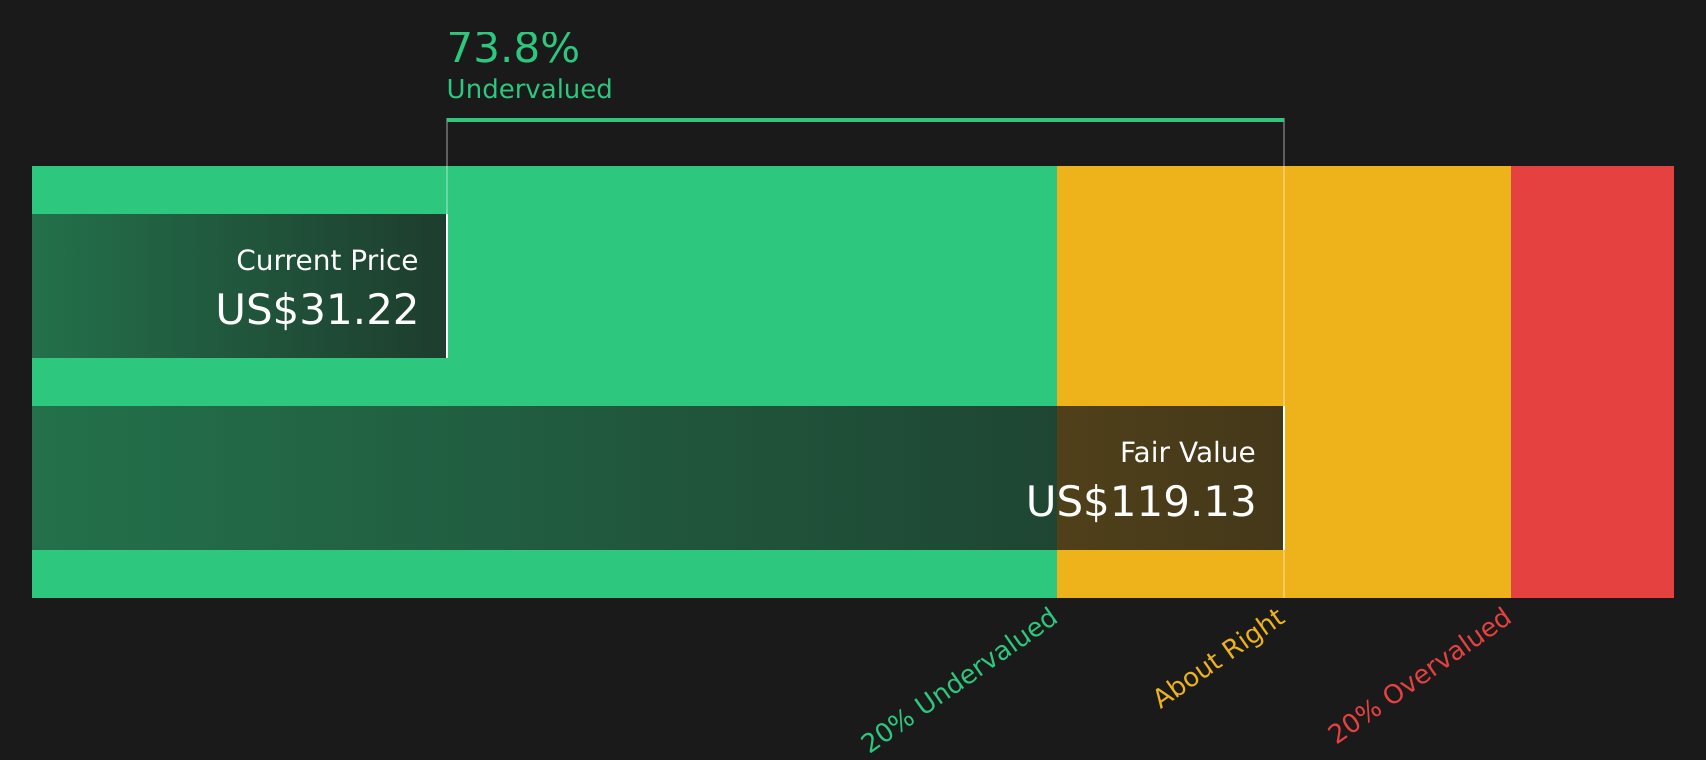
Bringing all those projected and discounted cash flows together, the DCF model arrives at an intrinsic value of about $113.27 per share. Compared with the current share price of around $34.48, the model suggests Genpact is trading at a 69.6% discount, which indicates that the stock appears significantly undervalued on this measure.
Result: UNDERVALUED
Our Discounted Cash Flow (DCF) analysis suggests Genpact is undervalued by 69.6%. Track this in your watchlist or portfolio, or discover 51 more high quality undervalued stocks.
Approach 2: Genpact Price vs Earnings
For profitable companies, the P/E ratio is a useful way for you to relate what you pay for the stock to the earnings it currently generates. A higher P/E usually reflects higher growth expectations or lower perceived risk, while a lower P/E can reflect more modest growth expectations or higher perceived risk.
Genpact currently trades on a P/E of about 10.6x. This sits below both the Professional Services industry average P/E of about 19.2x and the peer group average of around 20.2x. Simply Wall St also calculates a proprietary “Fair Ratio” for Genpact of about 20.2x. This is the P/E level that would typically be expected after considering factors such as the company’s earnings growth profile, profit margins, industry, market cap and specific risks.
The Fair Ratio aims to be more tailored than a simple comparison with peers or the industry because it adjusts for Genpact’s own characteristics rather than assuming all companies deserve the same multiple. Comparing the Fair Ratio of about 20.2x with the current P/E of about 10.6x suggests the stock is trading below this estimate of fair value on an earnings basis.
Result: UNDERVALUED

P/E ratios tell one story, but what if the real opportunity lies elsewhere? Start investing in legacies, not executives. Discover our 18 top founder-led companies.
Upgrade Your Decision Making: Choose your Genpact Narrative
Earlier it was mentioned that there is an even better way to understand valuation, so this is where Narratives come in as a simple way for you to connect your view of Genpact’s story with the numbers behind it by linking a business description, a financial forecast and a fair value in one place.
On Simply Wall St’s Community page, Narratives let you set assumptions for future revenue, earnings, margins and a fair P/E, then compare that Fair Value with the current share price so you can assess for yourself whether Genpact looks interesting as a potential investment based on your own expectations.
Because Narratives update automatically when new information arrives, such as earnings or partnership news, your fair value view stays aligned with the latest data instead of being based on a one off calculation.
For example, one Genpact Narrative might look closer to the higher analyst price target of US$58.0, with stronger confidence in AI partnerships, margin expansion and ongoing buybacks. Another might sit nearer the lower US$37.0 view, placing more weight on slower legacy services and execution risk. Your task as an investor is to decide which story and set of assumptions you find more reasonable.
Do you think there's more to the story for Genpact? Head over to our Community to see what others are saying!

This article by Simply Wall St is general in nature. We provide commentary based on historical data and analyst forecasts only using an unbiased methodology and our articles are not intended to be financial advice. It does not constitute a recommendation to buy or sell any stock, and does not take account of your objectives, or your financial situation. We aim to bring you long-term focused analysis driven by fundamental data. Note that our analysis may not factor in the latest price-sensitive company announcements or qualitative material. Simply Wall St has no position in any stocks mentioned.