Is Helmerich & Payne (HP) Still Attractive After Strong 1-Year Share Price Run?
Helmerich & Payne, Inc. HP | 34.81 | +0.78% |
- If you are wondering whether Helmerich & Payne at around US$35.97 is still offering value, you are not alone. This article is aimed at helping you size up what you are actually paying for.
- The stock has returned 6.2% over the last 7 days, 17.4% over the last 30 days, 20.1% year to date, 40.6% over 1 year, negative 9.8% over 3 years and 56.7% over 5 years. This gives you a wide range of outcomes to think about in terms of growth potential and changing risk sentiment.
- Recent attention on Helmerich & Payne has been driven more by ongoing sector interest and company specific developments than by a single headline event. This backdrop helps explain why the stock has seen strong shorter term returns while its longer term track record is more mixed.
- On our checks, Helmerich & Payne scores 5 out of 6 on valuation, as shown in its 5/6 value score. Next we will look at how different valuation methods line up on the stock, before finishing with a way of thinking about value that can be even more useful than any single model.
Approach 1: Helmerich & Payne Discounted Cash Flow (DCF) Analysis
A Discounted Cash Flow, or DCF, model takes the cash Helmerich & Payne is expected to generate in the future and discounts those projections back to what they might be worth in today’s dollars.
For Helmerich & Payne, the latest twelve month Free Cash Flow is about $22.77 million. Using a 2 Stage Free Cash Flow to Equity model, analysts provide explicit forecasts for the next few years. Projections are then extended out to 2035 by Simply Wall St. By 2030, annual Free Cash Flow is projected at $308 million, with a ten year path of estimated cash flows that gradually adjust from analyst inputs to extrapolated figures.
When these projected cash flows are discounted back to today, the DCF model suggests an estimated intrinsic value of about $58.74 per share. Compared with the current price of around $35.97, this implies roughly a 38.8% discount, which points to the shares trading below this model’s estimate of value.
Result: UNDERVALUED
Our Discounted Cash Flow (DCF) analysis suggests Helmerich & Payne is undervalued by 38.8%. Track this in your watchlist or portfolio, or discover 52 more high quality undervalued stocks.

Approach 2: Helmerich & Payne Price vs Sales
For companies where earnings can be volatile, the P/S ratio can be a useful way to compare what investors are paying for each dollar of revenue, rather than profits that may swing with the cycle.
In general, higher growth expectations and lower perceived risk can support a higher “normal” multiple, while slower growth or higher risk usually justify a lower one. That idea applies to P/S just as it does to P/E.
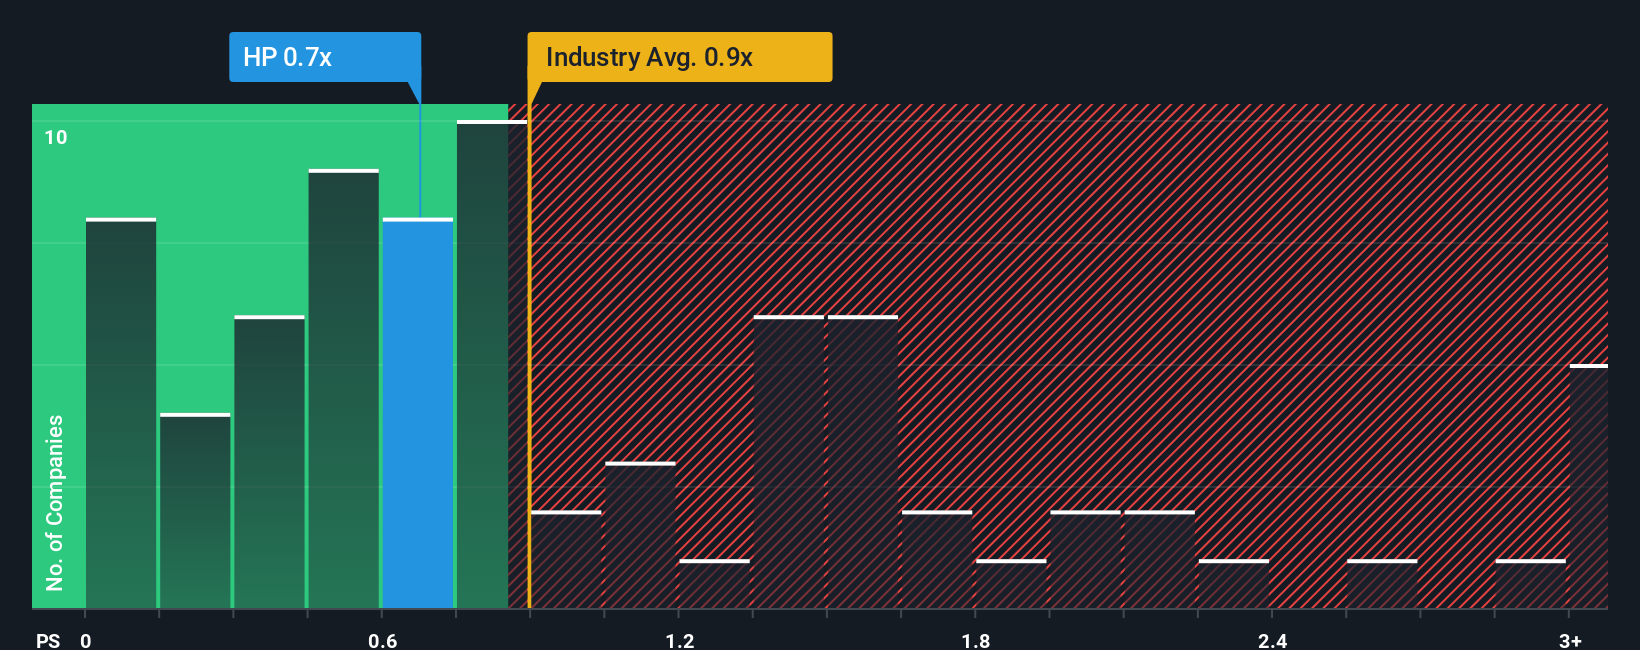
Helmerich & Payne currently trades on a P/S ratio of 0.88x. This sits below the Energy Services industry average P/S of 1.22x and also below the peer average of 1.48x. On the surface, that suggests the market is assigning a lower revenue multiple than many comparable companies.
Simply Wall St’s Fair Ratio for Helmerich & Payne is 0.91x. This is a proprietary estimate of what the P/S might be, given factors such as the company’s earnings growth profile, industry, profit margins, market value and key risks. Because it reflects these company specific inputs, it can be more informative than simply lining the stock up against broad industry or peer averages.
With the actual P/S at 0.88x versus a Fair Ratio of 0.91x, the shares look about right on this measure.
Result: ABOUT RIGHT
P/S ratios tell one story, but what if the real opportunity lies elsewhere? Start investing in legacies, not executives. Discover our 22 top founder-led companies.
Upgrade Your Decision Making: Choose your Helmerich & Payne Narrative
Earlier we mentioned that there is an even better way to understand valuation, so let us introduce you to Narratives. Narratives let you put a clear story behind your numbers by tying your view on Helmerich & Payne’s future revenue, earnings and margins to a financial forecast and then to your own fair value estimate.
On Simply Wall St’s Community page, millions of investors use Narratives as an easy tool. You can set your assumptions, see the resulting fair value, and compare that to the current share price to help decide whether the stock looks attractive, fully priced or expensive for your goals.
Because Narratives refresh when new information such as earnings releases or news is added to the platform, your story and fair value are not static. They evolve as the facts change and you adjust your expectations.
For example, one Helmerich & Payne Narrative might assume a relatively cautious fair value and modest growth. Another might assume a much higher fair value and stronger growth, which shows how different investors can look at the same company and reach very different conclusions.
Do you think there's more to the story for Helmerich & Payne? Head over to our Community to see what others are saying!

This article by Simply Wall St is general in nature. We provide commentary based on historical data and analyst forecasts only using an unbiased methodology and our articles are not intended to be financial advice. It does not constitute a recommendation to buy or sell any stock, and does not take account of your objectives, or your financial situation. We aim to bring you long-term focused analysis driven by fundamental data. Note that our analysis may not factor in the latest price-sensitive company announcements or qualitative material. Simply Wall St has no position in any stocks mentioned.