Is It Time To Reassess Alamo Group (ALG) After Recent Share Price Gains?
Alamo Group Inc. ALG | 168.20 | -1.06% |
- If you are wondering whether Alamo Group's share price still offers value at current levels, this article walks through what the numbers say about the stock.
- The shares last closed at US$195.52, with returns of 1.1% over the past week, 14.7% over the past month and year to date, 8.3% over 1 year, 25.2% over 3 years, and 34.1% over 5 years.
- Recent news coverage around Alamo Group has focused on providing ongoing, evergreen analysis of the business for investors who track industrial and capital goods names. This article is part of that coverage and aims to set the current share price in context rather than react to short term headlines.
- On our valuation checklist, Alamo Group scores a 4 out of 6. Next we look at how different valuation methods arrive at that score and why there may be an even better way to think about value by the end of the article.
Approach 1: Alamo Group Discounted Cash Flow (DCF) Analysis
A Discounted Cash Flow, or DCF, model estimates what a business might be worth today by projecting its future cash flows and then discounting those cash flows back to a present value.
For Alamo Group, the model uses a 2 Stage Free Cash Flow to Equity approach and starts with last twelve month free cash flow of about $150.0 million. Analysts provide explicit estimates up to 2026, where free cash flow is projected at $141.9 million, and Simply Wall St extends these out to 2035 using its own assumptions.
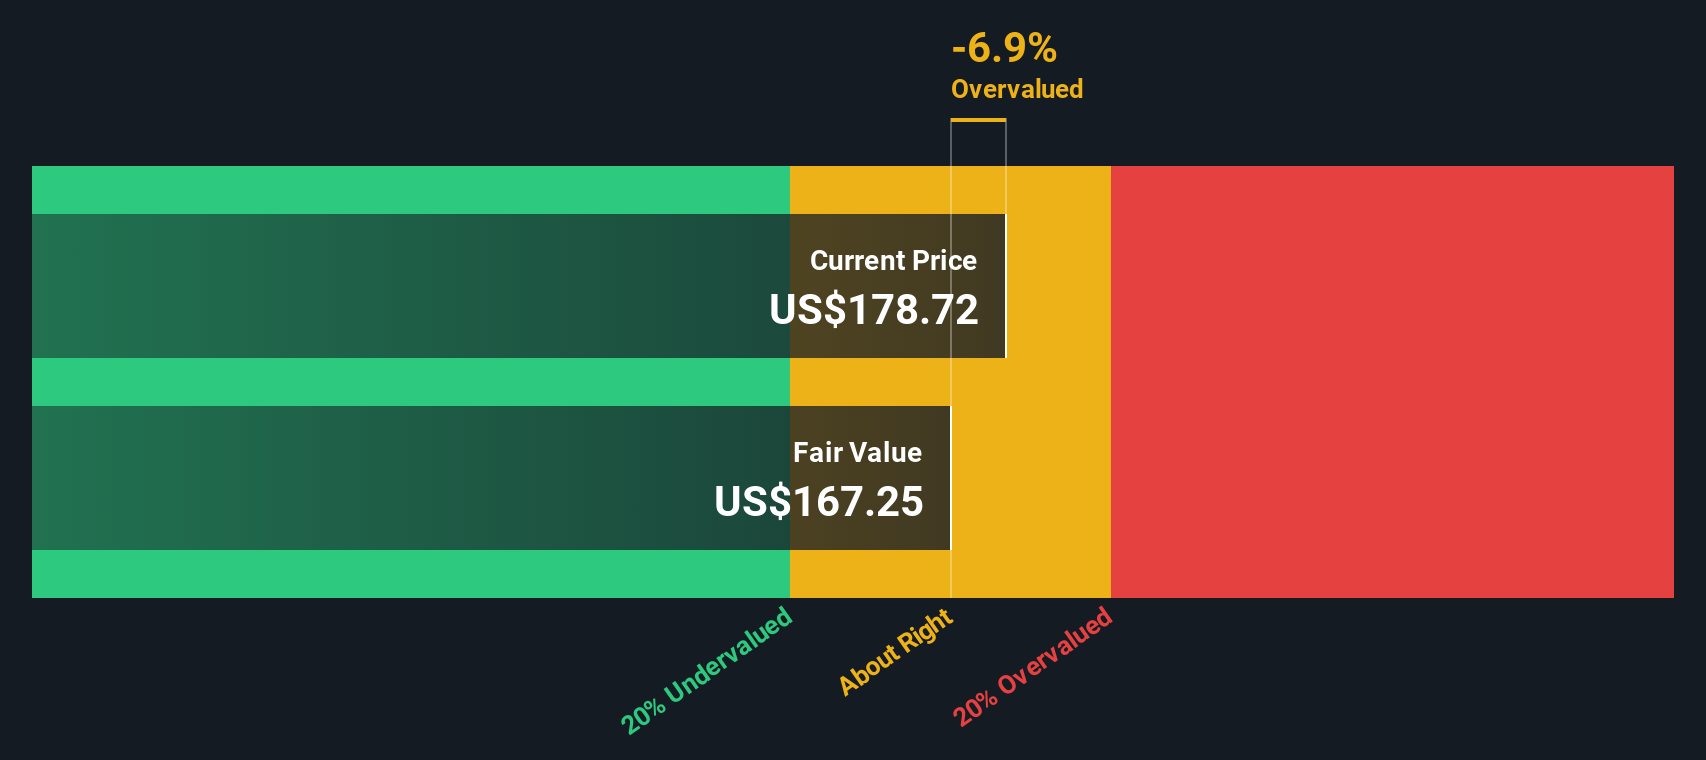
Across the ten year projection window, free cash flow estimates range from $141.9 million in 2026 to $164.4 million in 2035, with each year discounted back to reflect the time value of money. Adding those discounted cash flows together and including a terminal value results in an estimated intrinsic value of around US$196.37 per share.
Against the recent share price of US$195.52, the model suggests Alamo Group trades at roughly a 0.4% discount to this intrinsic value, which is effectively in line with the DCF output.
Result: ABOUT RIGHT
Alamo Group is fairly valued according to our Discounted Cash Flow (DCF), but this can change at a moment's notice. Track the value in your watchlist or portfolio and be alerted on when to act.
Approach 2: Alamo Group Price vs Earnings
For a profitable business like Alamo Group, the P/E ratio is a straightforward way to gauge what investors are currently paying for each dollar of earnings. It quickly connects the share price to the company’s ability to generate profit.
What counts as a “normal” P/E depends heavily on what investors expect for future growth and how much risk they see in the business. Higher growth or lower perceived risk can support a higher multiple, while slower growth or higher risk usually points to a lower one.
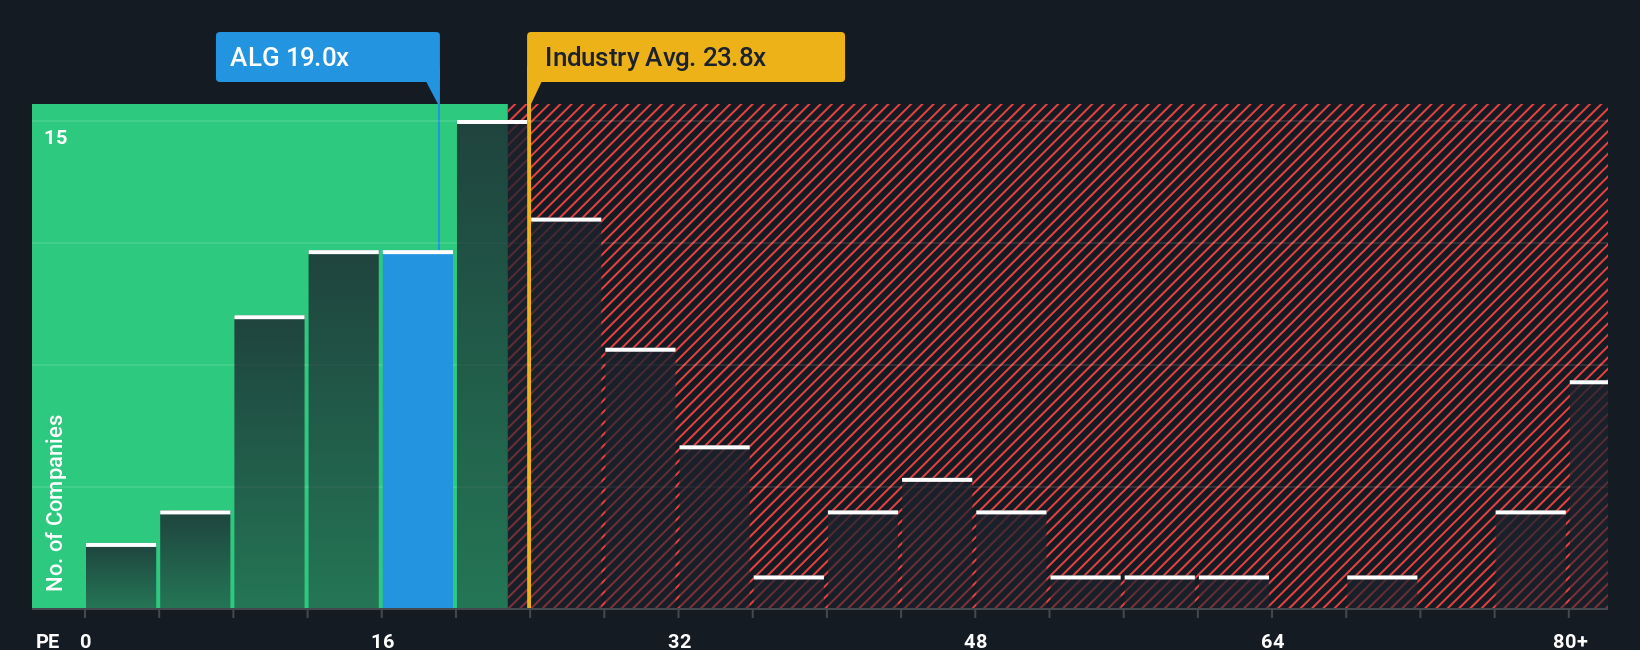
Alamo Group currently trades on a P/E of 20.36x. This is below the Machinery industry average P/E of 28.19x and below the peer average of 23.56x. Simply Wall St also calculates a Fair Ratio of 22.82x for Alamo Group. This Fair Ratio is a proprietary estimate of what the P/E might be, given factors like earnings growth, industry, profit margins, market cap and company specific risks.
Because the Fair Ratio is tailored to Alamo Group, it can be more informative than a simple comparison with industry or peer averages. With the current P/E of 20.36x sitting below the Fair Ratio of 22.82x, the shares appear undervalued on this metric.
Result: UNDERVALUED
P/E ratios tell one story, but what if the real opportunity lies elsewhere? Discover 1426 companies where insiders are betting big on explosive growth.
Upgrade Your Decision Making: Choose Your Alamo Group Narrative
Earlier we mentioned that there is an even better way to understand valuation, so let us introduce you to Narratives, which are simply your own story about a company linked directly to numbers like fair value, and your estimates for future revenue, earnings and margins.
On Simply Wall St, Narratives live in the Community page and are used by millions of investors as an easy tool that connects a company’s story to a financial forecast, then through to a fair value estimate that you can compare with the current share price to help you decide whether it looks more like a buying or selling opportunity for you.
Because Narratives sit on top of live data, they refresh automatically when new information comes in, such as earnings releases or major news. This means your fair value view is always grounded in the latest numbers without you needing to rebuild your work from scratch.
For Alamo Group, one investor might build a Narrative around a higher fair value per share, while another might set a lower fair value based on more cautious assumptions. The Community page lets you see those different viewpoints side by side.
Do you think there's more to the story for Alamo Group? Head over to our Community to see what others are saying!

This article by Simply Wall St is general in nature. We provide commentary based on historical data and analyst forecasts only using an unbiased methodology and our articles are not intended to be financial advice. It does not constitute a recommendation to buy or sell any stock, and does not take account of your objectives, or your financial situation. We aim to bring you long-term focused analysis driven by fundamental data. Note that our analysis may not factor in the latest price-sensitive company announcements or qualitative material. Simply Wall St has no position in any stocks mentioned.