Is It Time To Reassess Allstate (ALL) After The Recent Share Price Pullback?
Allstate Corporation ALL | 207.03 | +1.44% |
- If you are wondering whether Allstate's current share price lines up with its long term value, you are not alone. That is exactly what this article will unpack for you.
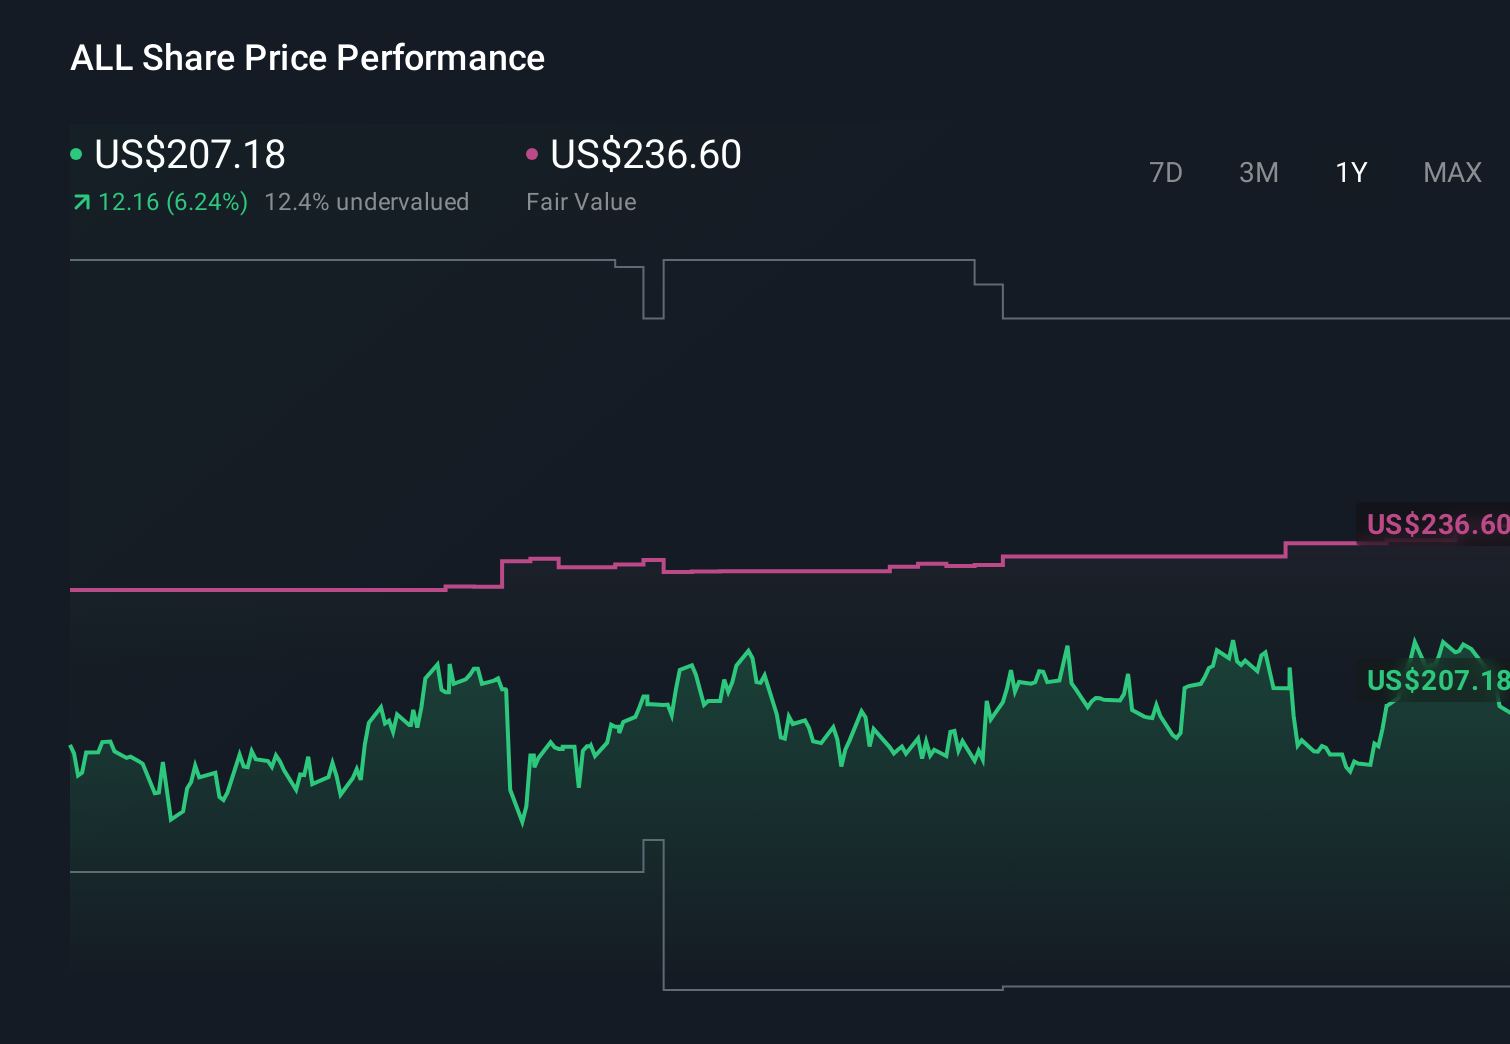
- After a strong multi year run, with returns of 64.1% over 3 years and 96.9% over 5 years, the stock has recently pulled back, with a 9.4% decline over 7 days, 8.0% over 30 days, and 5.7% year to date from a last close of US$192.28, while the 1 year return sits at 3.8%.
- Recent news flow around Allstate has focused on its position in the US insurance sector and how investors are thinking about risk, capital strength, and future growth opportunities for large insurers. That backdrop helps explain why short term sentiment can shift quickly, even when the longer term share price record looks very different.
- Against that context, Allstate currently scores a valuation check result of 6 out of 6. We will walk through what that means using different valuation approaches, before finishing with a way of thinking about value that can give you an even clearer picture of the stock.
Approach 1: Allstate Excess Returns Analysis
The Excess Returns model asks a simple question: is Allstate expected to earn more on its equity than it costs the company to raise that equity, and for how long can that gap persist? Those extra earnings above the required return are the “excess returns” that get capitalized into an intrinsic value per share.
For Allstate, analysts’ weighted estimates point to a stable earnings figure of $25.95 per share on a stable book value of $134.38 per share. That implies an average Return on Equity of 19.31%, compared with a cost of equity of $9.35 per share. The difference, an excess return of $16.60 per share, is what this model values.
Starting from a current book value of $97.34 per share and using the projected stable book value and earnings profile, the Excess Returns model arrives at an intrinsic value of about $583.45 per share. Against the recent share price of US$192.28, this points to an implied discount of roughly 67.0%, which classifies the stock as significantly undervalued on this framework.
Result: UNDERVALUED
Our Excess Returns analysis suggests Allstate is undervalued by 67.0%. Track this in your watchlist or portfolio, or discover 863 more undervalued stocks based on cash flows.

Approach 2: Allstate Price vs Earnings
For a profitable company like Allstate, the P/E ratio is a straightforward way to link what you pay today to the earnings the business is already generating. It is popular because it lets you compare companies of different sizes using a single, earnings based yardstick.
What counts as a “normal” or “fair” P/E depends on how the market views growth potential and risk. Higher expected growth or lower perceived risk can support a higher multiple, while slower expected growth or higher risk usually line up with a lower one.
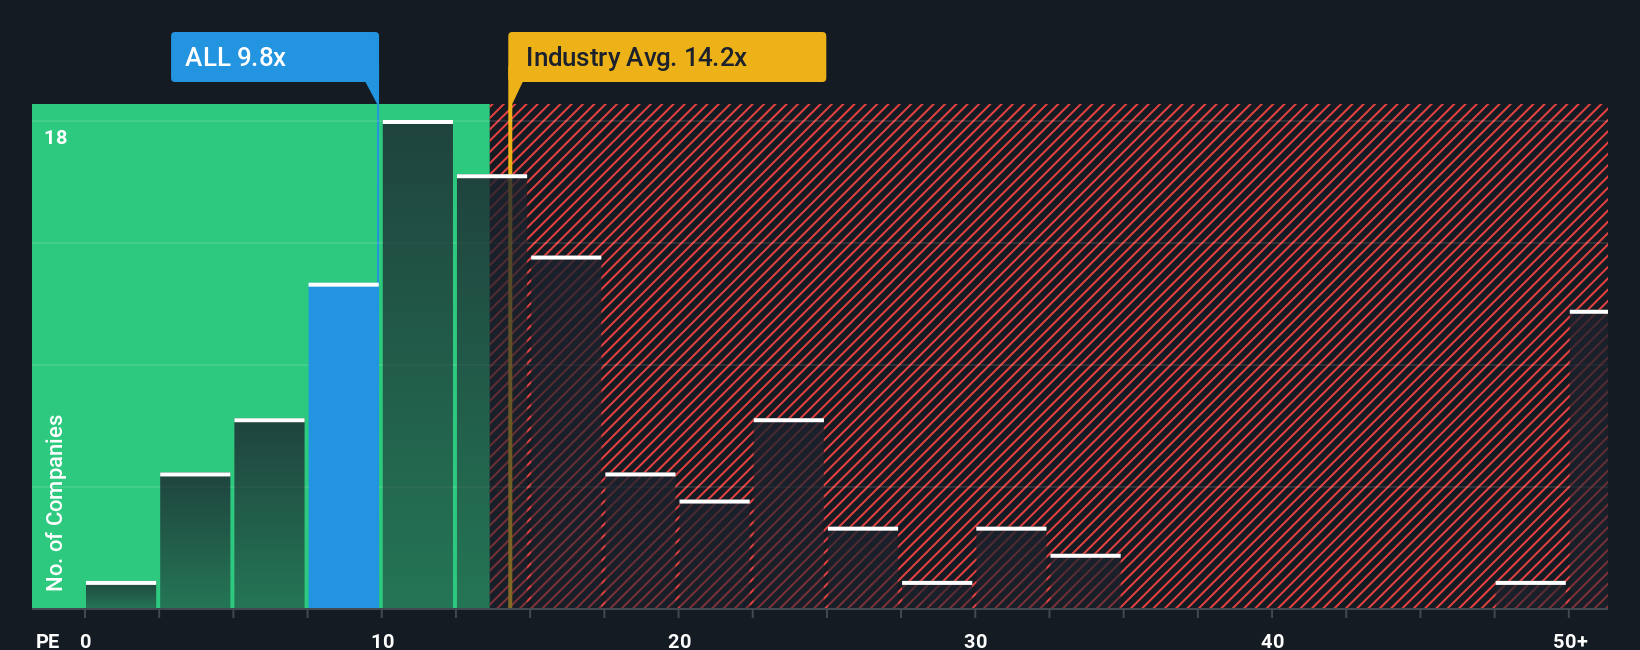
Allstate currently trades on a P/E of 6.09x. That sits below the Insurance industry average P/E of 12.84x and below the peer group average of 12.10x. Simply Wall St’s Fair Ratio for Allstate is 9.48x, which is its view of what the P/E might be given factors such as earnings characteristics, industry, profit margin, market cap and specific risks.
This Fair Ratio is more tailored than a simple peer or industry comparison because it folds those company specific inputs into a single benchmark. In a comparison of 6.09x to the 9.48x Fair Ratio, Allstate screens as undervalued on this metric.
Result: UNDERVALUED
P/E ratios tell one story, but what if the real opportunity lies elsewhere? Discover 1445 companies where insiders are betting big on explosive growth.
Upgrade Your Decision Making: Choose your Allstate Narrative
Earlier we mentioned that there is an even better way to understand valuation. On Simply Wall St’s Community page you can use Narratives, which are simple stories that link your view of Allstate’s business to a set of revenue, earnings and margin forecasts. They then connect those forecasts to a fair value, and help you decide what to do by comparing that fair value to the current price. Each Narrative updates automatically as fresh news or earnings arrive. One investor might focus on higher margins and use assumptions similar to the analyst consensus fair value of about US$236 per share, while another might anchor on the more cautious US$157 per share view. Narratives make both perspectives easy to see, compare and refine.
Do you think there's more to the story for Allstate? Head over to our Community to see what others are saying!
This article by Simply Wall St is general in nature. We provide commentary based on historical data and analyst forecasts only using an unbiased methodology and our articles are not intended to be financial advice. It does not constitute a recommendation to buy or sell any stock, and does not take account of your objectives, or your financial situation. We aim to bring you long-term focused analysis driven by fundamental data. Note that our analysis may not factor in the latest price-sensitive company announcements or qualitative material. Simply Wall St has no position in any stocks mentioned.