Is It Time To Reassess Apollo Global Management (APO) After S&P 500 Inclusion?
Apollo Global Management Inc APO | 0.00 |
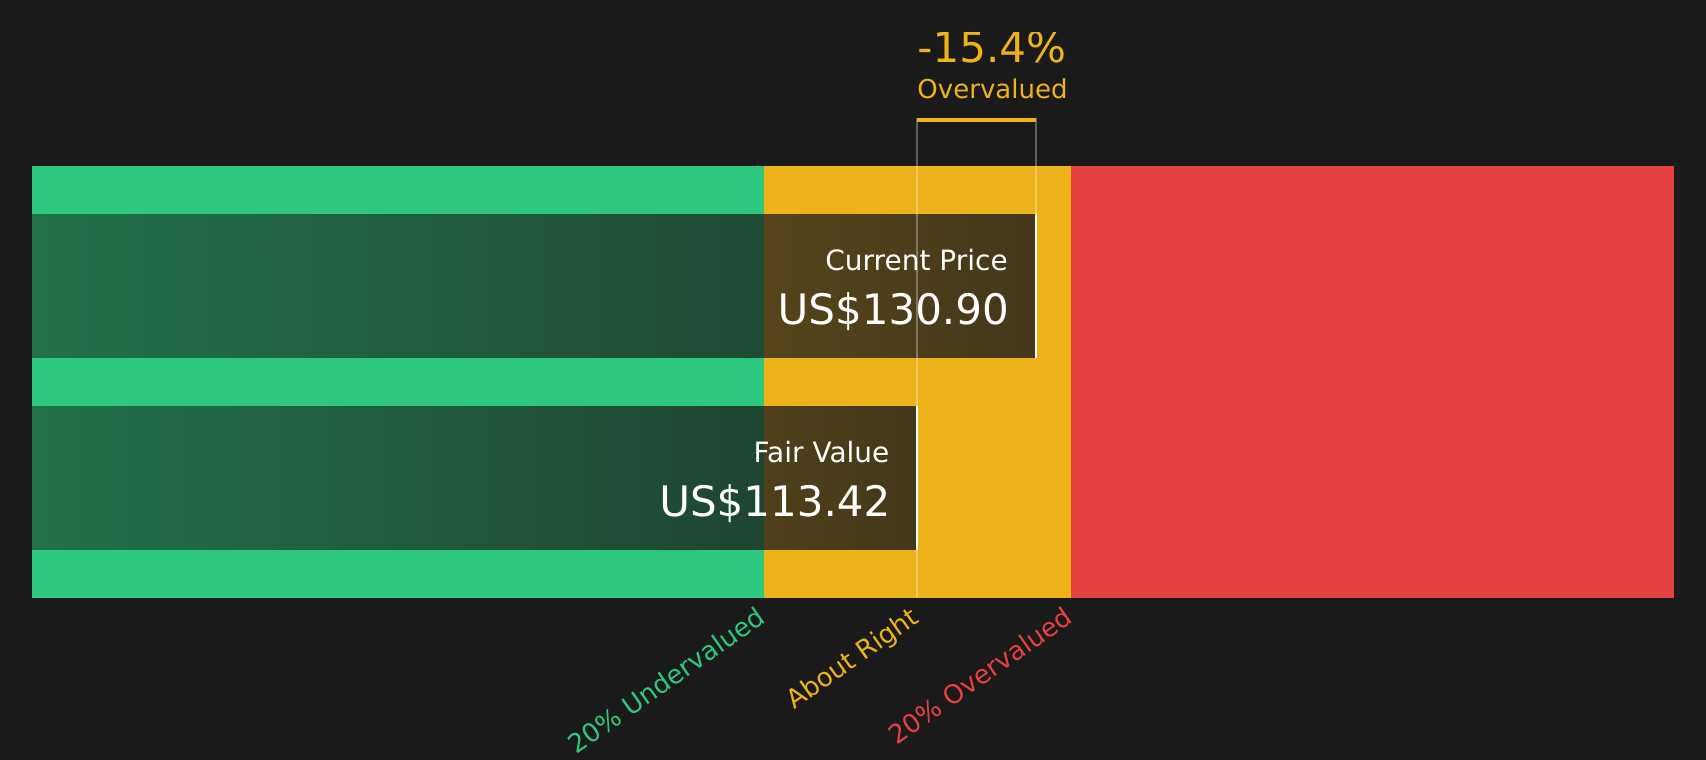
Before getting into the numbers, if you are wondering whether Apollo Global Management is attractively priced or starting to look stretched, it helps to compare its recent share performance with a clear view of what you are actually paying for.
Apollo Global Management scores just 2/6 on our valuation checks. See what other red flags we found in the full valuation breakdown.
Approach 1: Apollo Global Management Excess Returns Analysis
The Excess Returns model looks at how effectively Apollo Global Management turns its equity base into earnings after covering the required return that shareholders expect. Instead of focusing only on near term cash flows, it evaluates the ongoing value created on each dollar of equity.
For Apollo, the model uses a Book Value of $37.90 per share and a Stable EPS of $10.27 per share, based on weighted future Return on Equity estimates from 5 analysts. The Average Return on Equity is 16.87%, compared with a Cost of Equity of $5.04 per share. That gap is captured as an Excess Return of $5.23 per share, which reflects earnings above the level investors are assumed to require.
Analysts also expect a Stable Book Value of $60.92 per share, based on estimates from 3 analysts. Feeding these inputs into the Excess Returns framework produces an intrinsic value estimate of $168.57 per share. This is about 22.6% above the current share price, which indicates Apollo Global Management may be trading at a discount on this measure.
Result: UNDERVALUED
Our Excess Returns analysis suggests Apollo Global Management is undervalued by 22.6%. Track this in your watchlist or portfolio, or discover 51 more high quality undervalued stocks.
Approach 2: Apollo Global Management Price vs Earnings
For a profitable business like Apollo Global Management, the P/E ratio is a practical way to gauge what you are paying for each dollar of earnings. It ties the share price directly to current earnings, which is what most investors focus on when comparing opportunities.
What counts as a “normal” P/E depends on how the market views a company’s growth prospects and risk. Higher expected growth or lower perceived risk can justify a higher multiple, while lower growth or higher risk usually line up with a lower P/E.
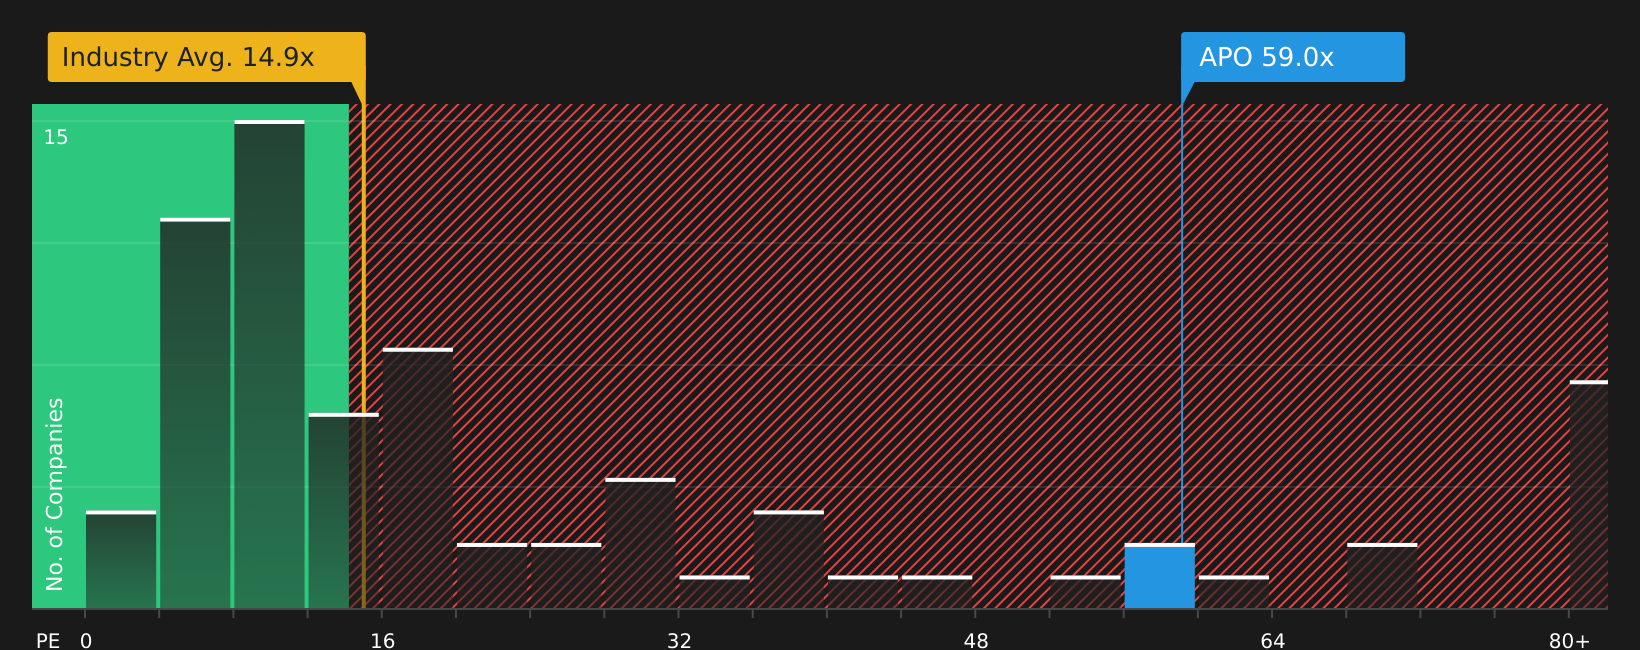
Apollo currently trades on a P/E of 21.47x. That is very close to the peer average of 21.45x and above the Diversified Financial industry average of 17.01x. Simply Wall St’s Fair Ratio for Apollo is 21.05x. This Fair Ratio is a proprietary estimate of what P/E might make sense for the company, after factoring in its earnings profile, industry, profit margins, market value and risk characteristics. It can be more informative than a simple peer or industry comparison because it adjusts for these company specific factors.
The gap between Apollo’s actual P/E of 21.47x and the Fair Ratio of 21.05x is small, which points to the shares being priced roughly in line with this metric.
Result: ABOUT RIGHT
P/E ratios tell one story, but what if the real opportunity lies elsewhere? Start investing in legacies, not executives. Discover our 18 top founder-led companies.
Upgrade Your Decision Making: Choose your Apollo Global Management Narrative
Earlier it was mentioned that there is an even better way to understand valuation. Narratives give you a simple story behind the numbers, where you set assumptions for Apollo Global Management’s future revenue, earnings, margins and fair value, link that story to a forecast, then compare your fair value with the current share price to consider whether the price looks attractive or stretched.
On Simply Wall St’s Community page, Narratives are an easy tool used by millions of investors. They update as new information such as earnings, price targets or news on items like Apollo’s S&P 500 inclusion or new funds comes through, so your view does not stay static.
For Apollo, one investor might build a Narrative close to the higher analyst price target of US$178.00, with strong confidence in the catalysts and future earnings assumptions. Another might lean toward the lower target of US$117.70, focusing more on risks such as competition, regulation or execution. Narratives let you see both ends of that range and consider where your own view fits.
Do you think there's more to the story for Apollo Global Management? Head over to our Community to see what others are saying!

This article by Simply Wall St is general in nature. We provide commentary based on historical data and analyst forecasts only using an unbiased methodology and our articles are not intended to be financial advice. It does not constitute a recommendation to buy or sell any stock, and does not take account of your objectives, or your financial situation. We aim to bring you long-term focused analysis driven by fundamental data. Note that our analysis may not factor in the latest price-sensitive company announcements or qualitative material. Simply Wall St has no position in any stocks mentioned.