

Is It Time To Reassess Citigroup (C) After Its Strong Five Year Share Price Run?
Citigroup Inc. C | 0.00 |
- If you are wondering whether Citigroup stock still offers value at recent prices, it helps to step back and look at what the current share price is really implying.
- Citigroup closed at US$124.68, with the share price down 0.4% over the last week and 3.0% over the last month, while still up 5.0% year to date, 68.8% over the last year and 86.2% over five years. This naturally raises questions about how much of the story is already reflected in the price.
- Recent coverage has focused on Citigroup's position within the broader US banking sector and how investors are reassessing large bank stocks in light of regulatory discussions and capital return decisions. This context helps explain why the stock has seen periods of strong gains alongside shorter term pullbacks as expectations are adjusted.
- On Simply Wall St's valuation checks, Citigroup scores 3 out of 6. The rest of this article will walk through what different valuation approaches say about the stock, while saving a more complete way to think about value for the conclusion.
Approach 1: Citigroup Excess Returns Analysis
The Excess Returns model looks at how much value Citigroup creates over and above the return that equity investors require, then capitalizes those “excess” profits into an intrinsic value per share.
For Citigroup, the model uses a Book Value of $112.23 per share and a Stable EPS of $13.08 per share, based on weighted future Return on Equity estimates from 14 analysts. The Average Return on Equity is 10.25%, compared with a Cost of Equity of $10.30 per share. That gap feeds into an Excess Return estimate of $2.79 per share.
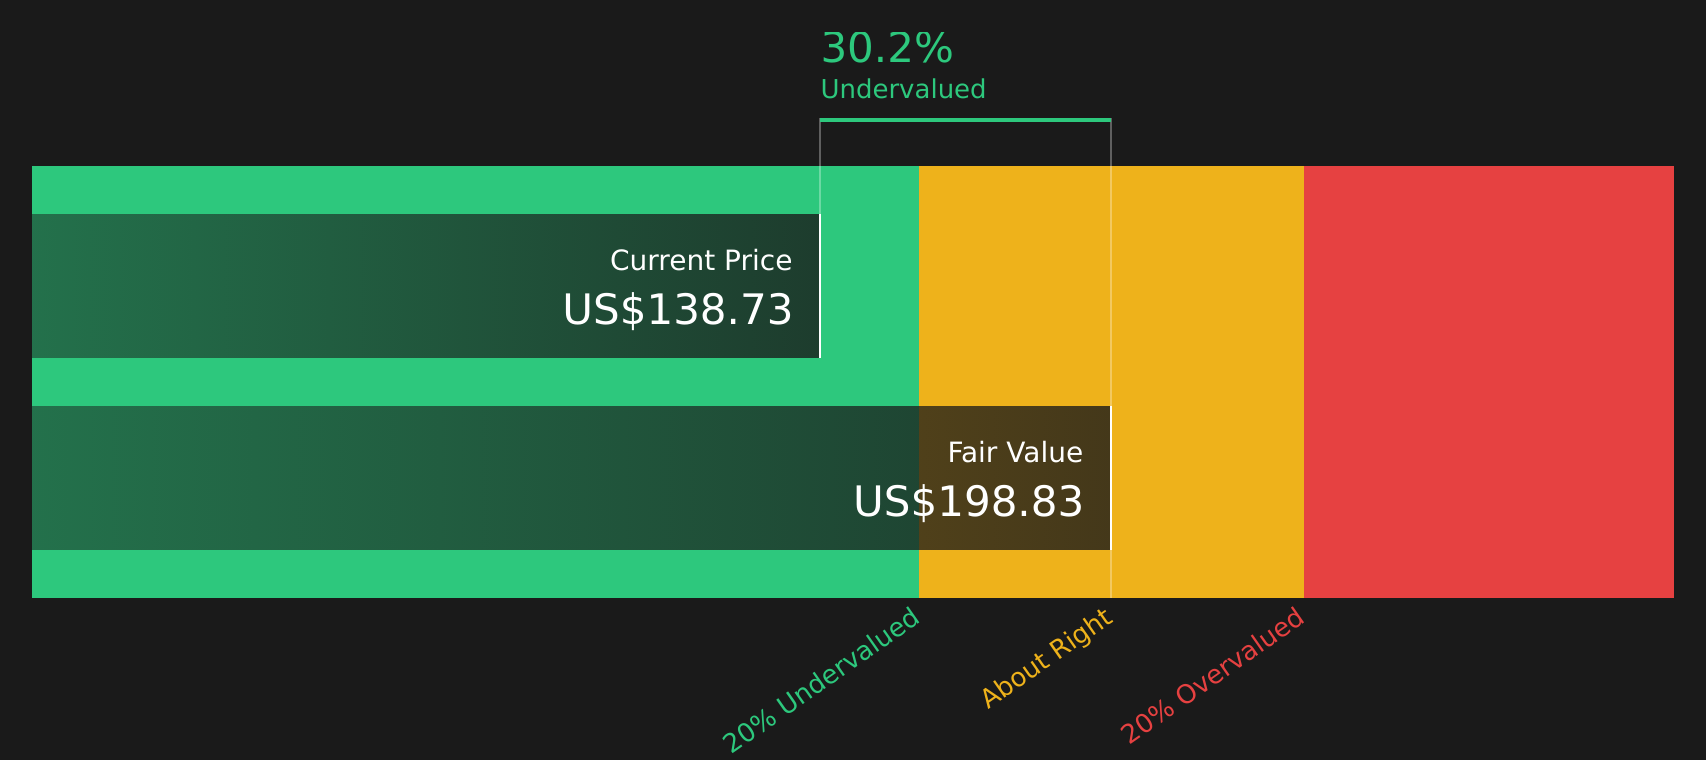
The analysis also assumes a Stable Book Value of $127.67 per share, based on weighted future Book Value estimates from 12 analysts. Combining these inputs, the Excess Returns framework arrives at an intrinsic value of about $189.29 per share for Citigroup.
Compared with the recent share price of US$124.68, this implies a 34.1% discount, which indicates that the stock is trading below the model’s estimate of fair value.
Result: UNDERVALUED
Our Excess Returns analysis suggests Citigroup is undervalued by 34.1%. Track this in your watchlist or portfolio, or discover 46 more high quality undervalued stocks.
Approach 2: Citigroup Price vs Earnings
For profitable companies, the P/E ratio is a useful way to think about value because it links what you pay for each share with the earnings that each share generates. A higher or lower P/E can make sense depending on what investors expect for future growth and how much risk they see in those earnings.
Citigroup currently trades on a P/E of 14.47x. That sits above the Banks industry average of 11.50x and the peer average of 11.88x, which suggests investors are paying more per dollar of earnings than for many other large banks. On its own, that comparison does not tell you whether the stock is expensive, only that the market is assigning a higher multiple.
Simply Wall St’s Fair Ratio for Citigroup is 15.60x. This is a proprietary P/E estimate that reflects factors such as the company’s earnings growth profile, industry, profit margins, market value and specific risks. Because it adjusts for these company level features, the Fair Ratio can be more informative than a simple comparison with peers or the broad industry. With the actual P/E at 14.47x versus a Fair Ratio of 15.60x, Citigroup appears modestly undervalued on this metric.
Result: UNDERVALUED

P/E ratios tell one story, but what if the real opportunity lies elsewhere? Start investing in legacies, not executives. Discover our 21 top founder-led companies.
Upgrade Your Decision Making: Choose your Citigroup Narrative
Earlier it was mentioned that there is an even better way to understand valuation. Narratives are Simply Wall St’s way of letting you attach a clear story to Citigroup’s numbers by linking your view on its future revenue, earnings and margins to a forecast and then to a fair value that you can compare with today’s price.
On the Community page, Narratives are available as an easy tool that many investors already use, and they update automatically when fresh information like earnings or news is added, so your fair value view is not stuck in time.
For Citigroup, one investor might build a Narrative using a fair value of US$112.86 with assumptions that sit at the cautious end of analyst expectations, while another uses a fair value of US$233.04 at the optimistic end. Seeing those side by side helps you decide whether the current share price looks closer to your own story or closer to someone else’s.
For Citigroup however we will make it really easy for you with previews of two leading Citigroup Narratives:
Fair value: US$233.04
Implied discount to this fair value: 46.5% below the narrative fair value based on the recent US$124.68 share price
Revenue growth assumption: 6%
- Focuses on Citi Token Services and stablecoins under the GENIUS Act framework, with Citi positioned as a key institutional payments platform.
- Highlights broad momentum across Markets, Investment Banking, Services, Wealth and U.S. Personal Banking with a detailed discussion of segment level returns and profitability.
- Emphasizes multi year transformation, AI and automation efforts, capital returns through buybacks and dividends, and a thesis that the stock is undervalued relative to this setup.
Fair value: US$112.86
Implied premium to this fair value: 10.5% above the narrative fair value based on the recent US$124.68 share price
Revenue growth assumption: 8.32%
- Builds a cautious case that ties fair value to the lower end of analyst price targets, using earnings, margin and P/E assumptions that sit with the bearish cohort.
- Points to transformation and technology spending, regulatory requirements and credit risk as factors that could weigh on margins and net income even as expenses are simplified over time.
- Argues that if revenues, margins and the future P/E ratio track these more conservative assumptions, Citigroup stock is closer to fairly priced or slightly expensive at recent levels.
Putting these side by side shows how different assumptions about earnings quality, capital returns and the value investors may place on Citi's future cash flows can lead to very different fair values. The key step for you is to decide which story feels closer to your own expectations for the business and how comfortable you are with the risks that each narrative highlights.
To see how these results tie into long term growth, risks and valuation across a broader set of companies, you can also look at a screener focused on balance sheet strength and fundamentals such as the solid balance sheet and fundamentals stocks screener (46 results)
Do you think there's more to the story for Citigroup? Head over to our Community to see what others are saying!

This article by Simply Wall St is general in nature. We provide commentary based on historical data and analyst forecasts only using an unbiased methodology and our articles are not intended to be financial advice. It does not constitute a recommendation to buy or sell any stock, and does not take account of your objectives, or your financial situation. We aim to bring you long-term focused analysis driven by fundamental data. Note that our analysis may not factor in the latest price-sensitive company announcements or qualitative material. Simply Wall St has no position in any stocks mentioned.