Is It Time To Reassess Coupang (CPNG) After Its Recent Share Price Slide?
Coupang, Inc. Class A CPNG | 0.00 |
- If you are wondering whether Coupang's current share price offers good value or if recent weakness is a warning sign, this article breaks down what the numbers indicate about the stock.
- Coupang's share price closed at US$17.22, with returns of a 13.8% decline over 7 days, a 10.3% decline over 30 days, a 26.3% decline year to date and a 32.8% decline over 1 year, set against a 5.1% gain over 3 years and a 46.3% decline over 5 years.
- Recent coverage of Coupang has focused on its position in the Multiline Retail space and how investors are reassessing growth expectations and risk after a weak share price run. This has increased attention on whether the current valuation fairly reflects the business profile and long-term prospects.
- On Simply Wall St's valuation checks, Coupang scores 5 out of 6. This raises a clear question: do traditional tools such as DCF models and multiples tell the whole story, or is there an even better way to think about value that will be covered later in this article?
Approach 1: Coupang Discounted Cash Flow (DCF) Analysis
A Discounted Cash Flow, or DCF, model estimates what a stock could be worth by projecting future cash flows and then discounting them back to today, so you can compare that value with the current share price.
For Coupang, the model used is a 2 Stage Free Cash Flow to Equity approach. The latest twelve month free cash flow is about $369.3 million. Analyst estimates and further extrapolations point to free cash flow of $2.888b in 2030, with interim projections between 2026 and 2035 ranging from a loss of $325 million in 2026 to projected free cash flows above $4.5b by 2035 according to the provided schedule.
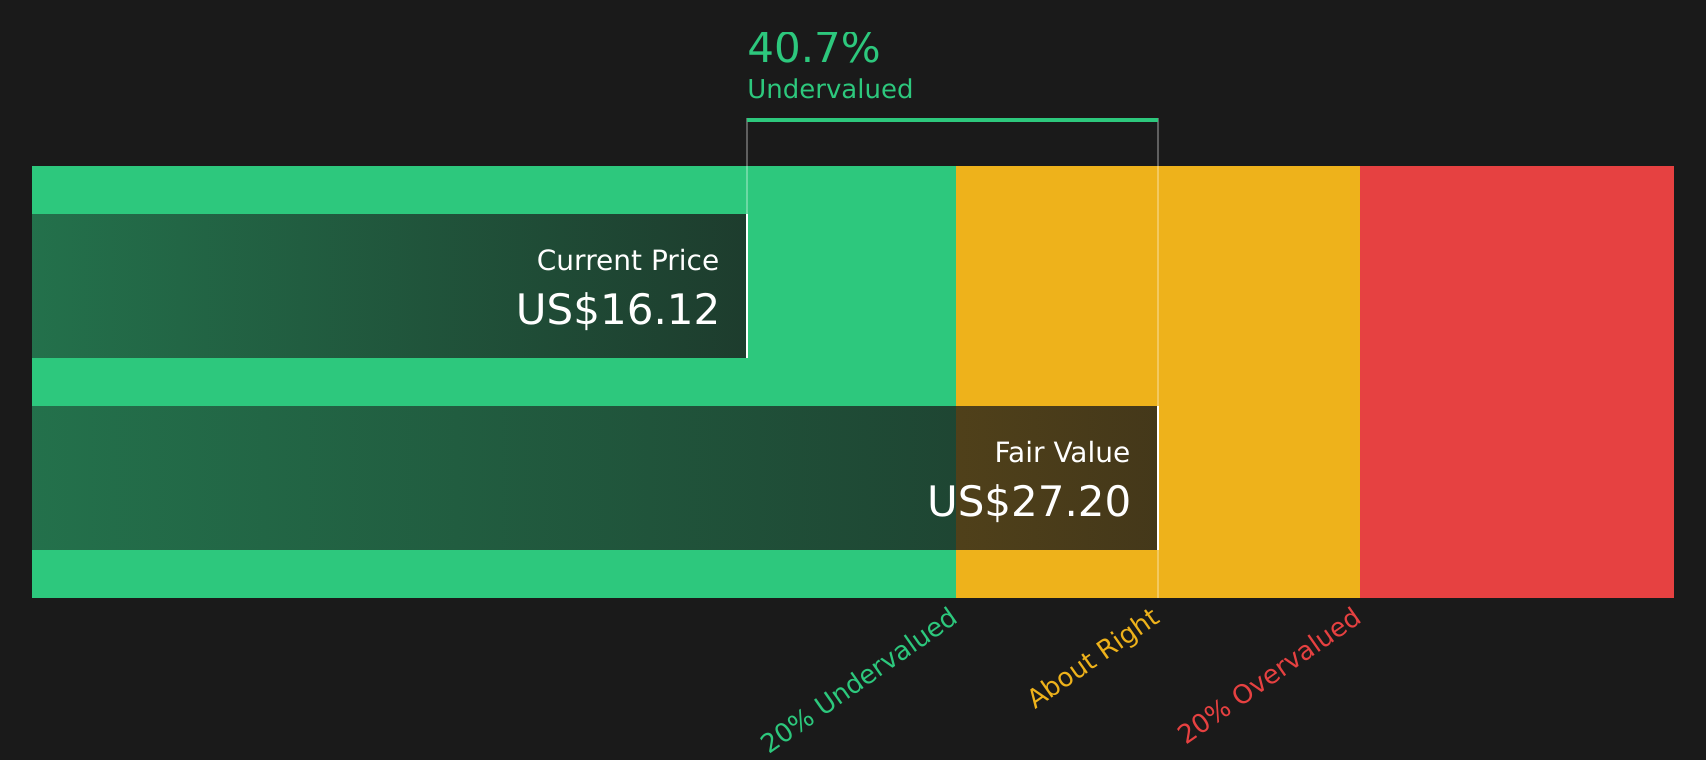
When these projected cash flows are discounted back using the DCF framework, Simply Wall St arrives at an estimated intrinsic value of about $27.57 per share. Compared with the recent share price of $17.22, this output implies that Coupang stock is trading at roughly a 37.5% discount, which the model flags as undervalued on this basis.
Result: UNDERVALUED
Our Discounted Cash Flow (DCF) analysis suggests Coupang is undervalued by 37.5%. Track this in your watchlist or portfolio, or discover 51 more high quality undervalued stocks.
Approach 2: Coupang Price vs Sales
For profitable and scaling retailers, the P/S ratio is a useful way to see how much investors are paying for each dollar of revenue, especially when earnings can be affected by investment, expansion and accounting factors.
What you “should” pay on a P/S ratio usually reflects how much growth you expect from those sales and how confident you are about the risks around margins and competition. Higher growth and lower perceived risk can justify a higher multiple, while slower growth or higher risk typically calls for a lower one.
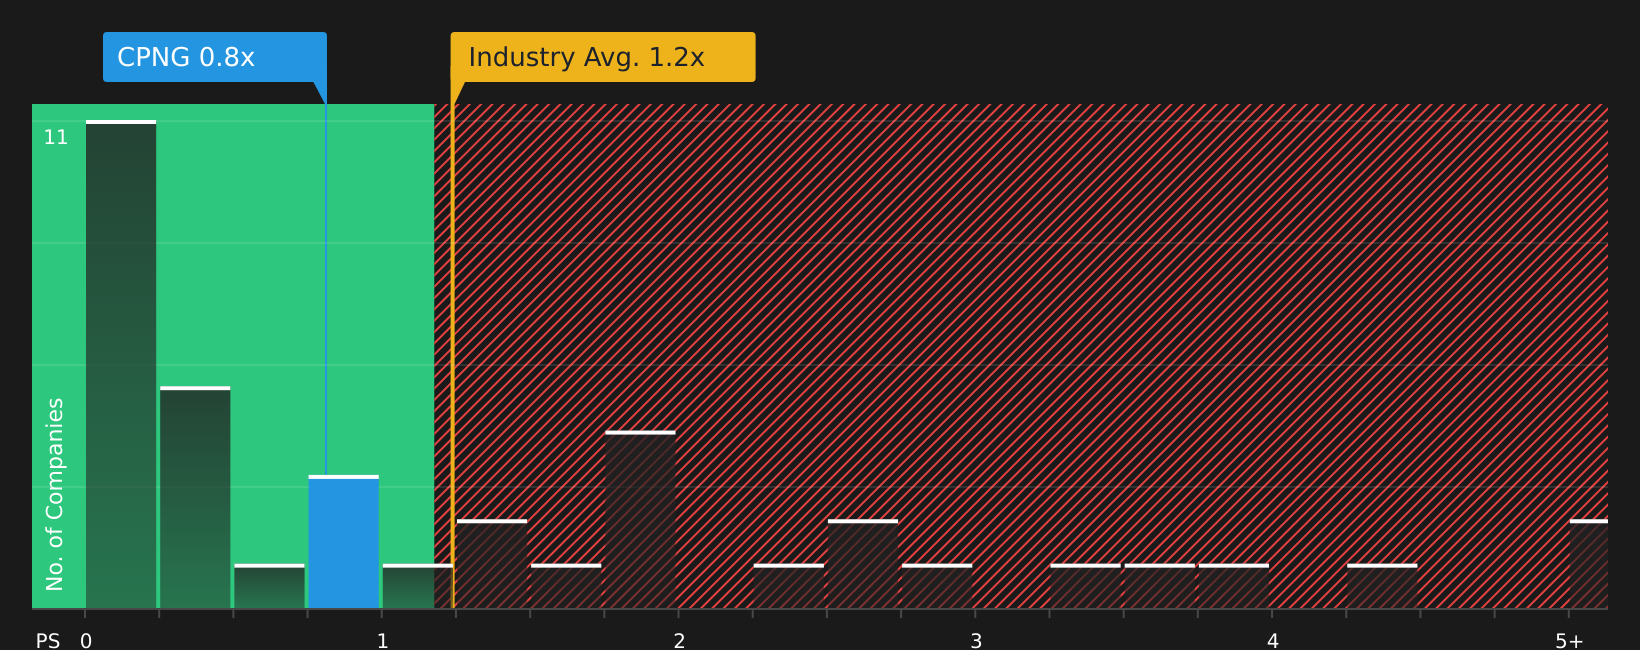
Coupang currently trades on a P/S ratio of 0.88x. That sits below the Multiline Retail industry average of 1.18x and also below the peer group average of 2.48x. Simply Wall St’s Fair Ratio for Coupang is 1.35x. This is the P/S multiple suggested after accounting for factors such as earnings growth, profit margins, industry, market cap and risk.
This Fair Ratio is more tailored than a simple comparison with peers or the industry, because it adjusts for company specific characteristics rather than assuming all retailers deserve the same multiple. Comparing Coupang’s current 0.88x P/S to the Fair Ratio of 1.35x indicates that the stock is trading below that suggested level.
Result: UNDERVALUED
P/S ratios tell one story, but what if the real opportunity lies elsewhere? Start investing in legacies, not executives. Discover our 18 top founder-led companies.
Upgrade Your Decision Making: Choose your Coupang Narrative
Earlier it was mentioned that there is an even better way to understand valuation. Narratives step in as a simple way for you to attach a clear story about Coupang to the numbers such as your assumed fair value and expectations for future revenue, earnings and margins. You can then connect that story to a financial forecast and finally to a fair value that can be compared with the current price to help you decide whether to act or wait.
On Simply Wall St’s Community page, Narratives are available as an easy tool used by many investors. They are updated automatically when new information such as earnings or news is added, so your Coupang view does not stay static while the facts move.
For Coupang, one investor might align with a more optimistic Narrative that assumes a fair value around US$40.00 per share with revenue rising at 18.1% a year and profit margins reaching 5.1%. Another might prefer a more cautious Narrative closer to US$17.62 per share with revenue growth of 5.1% and margins at 2.9%. Seeing these side by side helps you quickly see which story feels closer to your own expectations before you make any buy or sell decision.
Do you think there's more to the story for Coupang? Head over to our Community to see what others are saying!

This article by Simply Wall St is general in nature. We provide commentary based on historical data and analyst forecasts only using an unbiased methodology and our articles are not intended to be financial advice. It does not constitute a recommendation to buy or sell any stock, and does not take account of your objectives, or your financial situation. We aim to bring you long-term focused analysis driven by fundamental data. Note that our analysis may not factor in the latest price-sensitive company announcements or qualitative material. Simply Wall St has no position in any stocks mentioned.