Is It Time To Reassess Klarna Group (KLAR) After A 48.5% Year To Date Decline?
Klarna Group Plc KLAR | 0.00 |
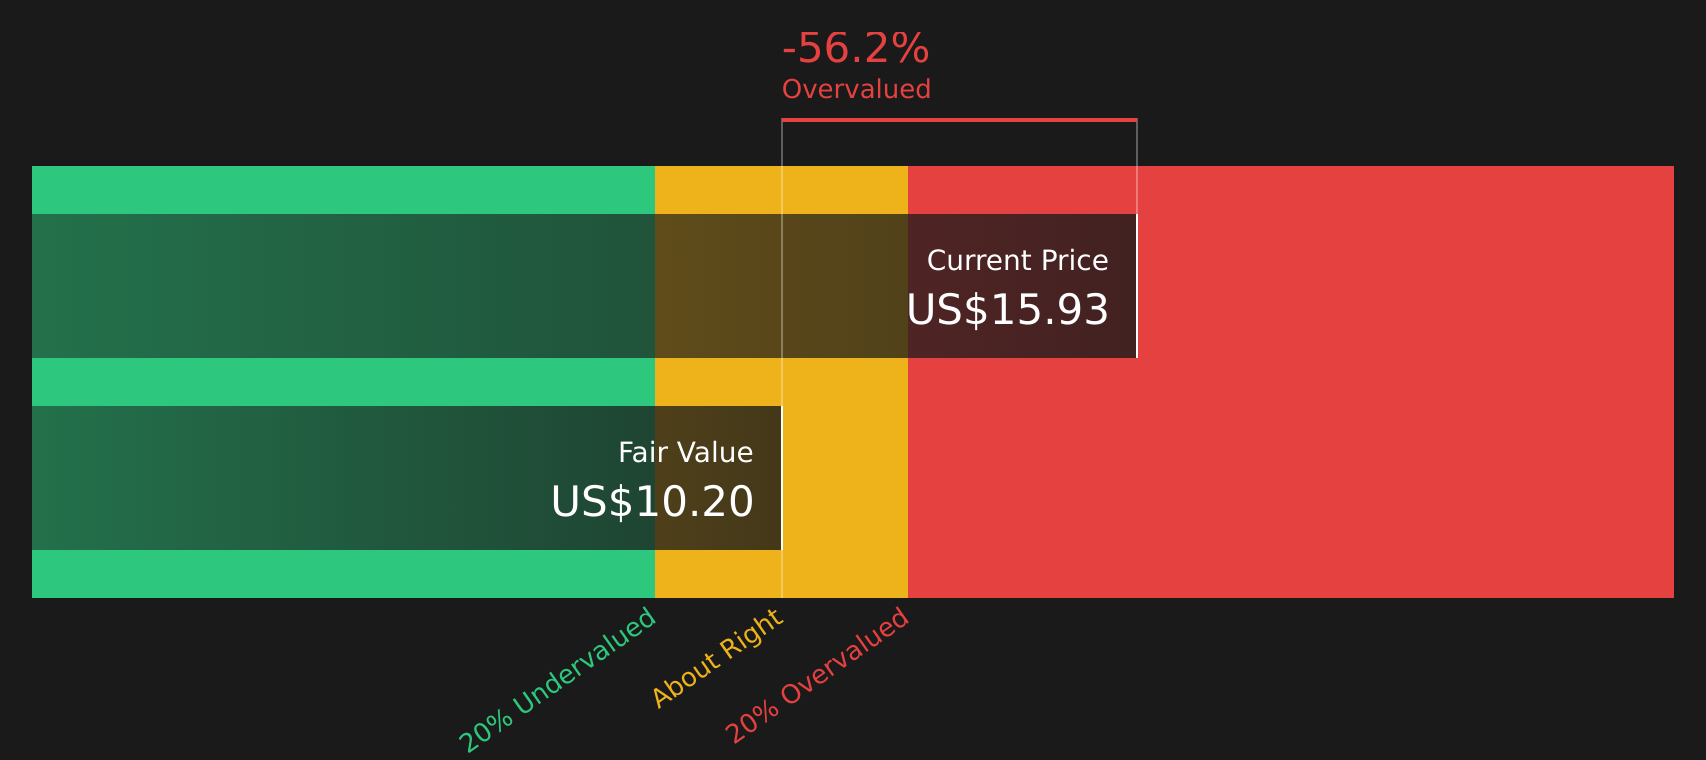
- If you are wondering whether Klarna Group stock is cheap, expensive, or somewhere in between right now, this breakdown is designed to give you a clear view of value.
- Over the short term, the share price has moved, with a 5.7% return over the last 7 days and 13.2% over the past month, set against a 48.5% decline year to date from a last close of US$14.72.
- Recent news coverage has focused on Klarna Group's position in diversified financials and how investors are reassessing risk and growth potential in the sector. Together with the share price swings, this context helps frame whether the current market price fairly reflects the business.
- Right now Klarna Group scores 3 out of 6 on our valuation checks, which you can see in detail in its valuation score. The next sections will compare different valuation methods before finishing with a way to bring those numbers together into a clearer big picture.
Approach 1: Klarna Group Excess Returns Analysis
The Excess Returns model looks at how much profit a company is expected to earn on its equity above the return required by shareholders, then converts that into a per share value.
For Klarna Group, the model uses a Book Value of US$6.64 per share and a Stable EPS of US$0.64 per share, based on weighted future Return on Equity estimates from 6 analysts. The Average Return on Equity used is 7.71%. Against this, the Cost of Equity is set at US$0.68 per share, which implies an Excess Return of a US$0.04 loss per share.
The Stable Book Value is US$8.26 per share, sourced from weighted future Book Value estimates from 5 analysts. Combining these inputs, the Excess Returns approach produces an intrinsic value of about US$7.34 per share for Klarna Group.
Compared with the recent share price of US$14.72, this Excess Returns valuation indicates the stock is 100.5% overvalued based on these assumptions.
Result: OVERVALUED
Our Excess Returns analysis suggests Klarna Group may be overvalued by 100.5%. Discover 51 high quality undervalued stocks or create your own screener to find better value opportunities.
Approach 2: Klarna Group Price vs Sales
For many profitable and revenue generating companies, the P/S ratio is a useful way to think about value because it links what you pay for each share directly to the sales that underpin the business. It can be especially helpful where earnings are more volatile or less representative of the underlying commercial footprint.
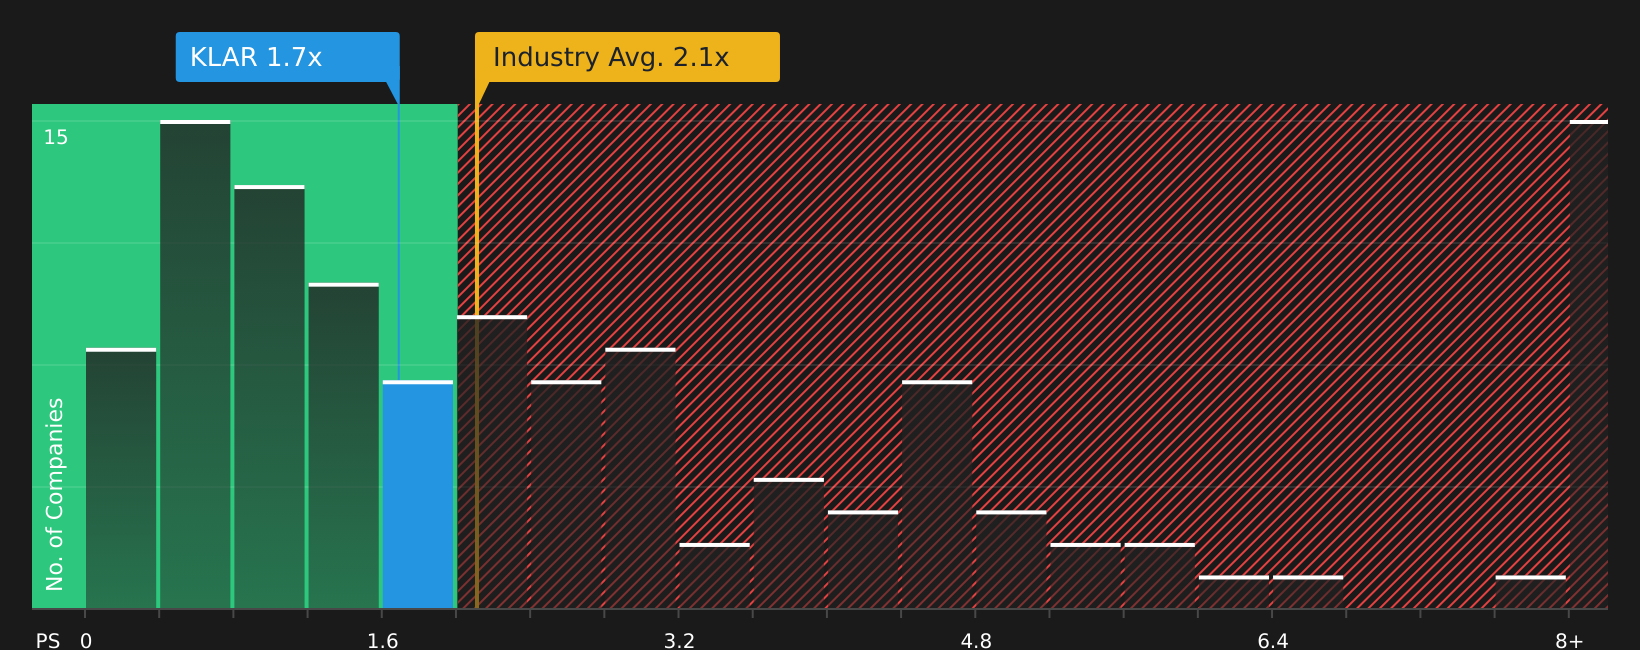
In general, higher expected growth and lower perceived risk tend to justify a higher “normal” or “fair” P/S multiple, while slower growth and higher risk usually point to a lower one. Klarna Group currently trades on a P/S ratio of 1.58x. That sits below the Diversified Financial industry average of 2.23x and the peer group average of 2.62x, suggesting the stock trades at a discount to those broad benchmarks.
Simply Wall St’s Fair Ratio for Klarna Group is 2.45x. This is a proprietary estimate of what P/S ratio might be appropriate after considering factors such as earnings growth, profit margins, risk profile, industry and market cap, rather than relying only on simple peer or sector comparisons. Because it folds these elements into a single figure, the Fair Ratio can give you a more tailored anchor than a plain industry or peer average. Compared with the current 1.58x P/S, the 2.45x Fair Ratio points to Klarna Group stock being undervalued on this measure.
Result: UNDERVALUED
P/S ratios tell one story, but what if the real opportunity lies elsewhere? Start investing in legacies, not executives. Discover our 19 top founder-led companies.
Upgrade Your Decision Making: Choose your Klarna Group Narrative
Earlier it was mentioned that there is an even better way to understand valuation. Narratives are introduced here as simple stories you build around your own forecast for Klarna Group, linking what you believe about its future revenue, earnings and margins to a Fair Value that can then be compared with the current share price. All of this occurs within Simply Wall St’s Community page where Narratives update automatically when new news or earnings arrive. One investor might back a more optimistic Klarna Group Narrative with a Fair Value around US$50.00, while another could lean toward a more cautious view closer to US$14.00. By seeing these side by side you can quickly judge which story fits your view of the company and whether the current market price looks high, low or roughly in line with the Fair Value you consider reasonable.
For Klarna Group however we will make it really easy for you with previews of two leading Klarna Group Narratives:
Together they show how different investors can look at the same data and reach very different conclusions on what the stock is worth today.
Fair value: US$43.01 per share
Implied discount to this fair value: 65.8%
Revenue growth used in this view: 19.32%
- Focuses on Klarna as a way for consumers to spread purchases through small, targeted loans and flexible payment plans rather than relying on high interest credit cards.
- Frames Klarna as a bridge between consumer demand and cash flow, which can help merchants convert more sales and support higher revenue.
- Fair value of US$43.01 reflects confidence in Klarna building out a broader digital banking and shopping assistant platform that monetizes purchasing power over time.
Fair value: US$14.00 per share
Implied premium to this fair value: 5.1%
Revenue growth used in this view: 21.21%
- Highlights that a larger mix of interest bearing products and upfront provisions can keep reported earnings and transaction margins volatile even as volumes scale.
- Points to potential pressure on net margins if funding, processing and servicing costs for capital intensive banking products are not reduced in line with growth.
- Links a US$14.00 fair value to assumptions about revenue, earnings, profit margins and a 15.1x P/E in 2029, and encourages investors to test those inputs against their own expectations.
These two narratives sit at opposite ends of the fair value range, yet both are built from concrete assumptions about revenue growth, margins and business mix. The key step for you as an investor is to decide which story feels closer to your view of Klarna Group, then see how that compares with the current share price and your risk tolerance.
To see how these results tie into long-term growth, risks, and valuation, check out the full range of community narratives for Klarna Group on Simply Wall St. Add the company to your watchlist or portfolio so you'll be alerted when the story evolves.
Do you think there's more to the story for Klarna Group? Head over to our Community to see what others are saying!

This article by Simply Wall St is general in nature. We provide commentary based on historical data and analyst forecasts only using an unbiased methodology and our articles are not intended to be financial advice. It does not constitute a recommendation to buy or sell any stock, and does not take account of your objectives, or your financial situation. We aim to bring you long-term focused analysis driven by fundamental data. Note that our analysis may not factor in the latest price-sensitive company announcements or qualitative material. Simply Wall St has no position in any stocks mentioned.