Is It Time To Reassess Main Street Capital (MAIN) After This Year’s Share Price Decline?
Main Street Capital Corporation MAIN | 0.00 |
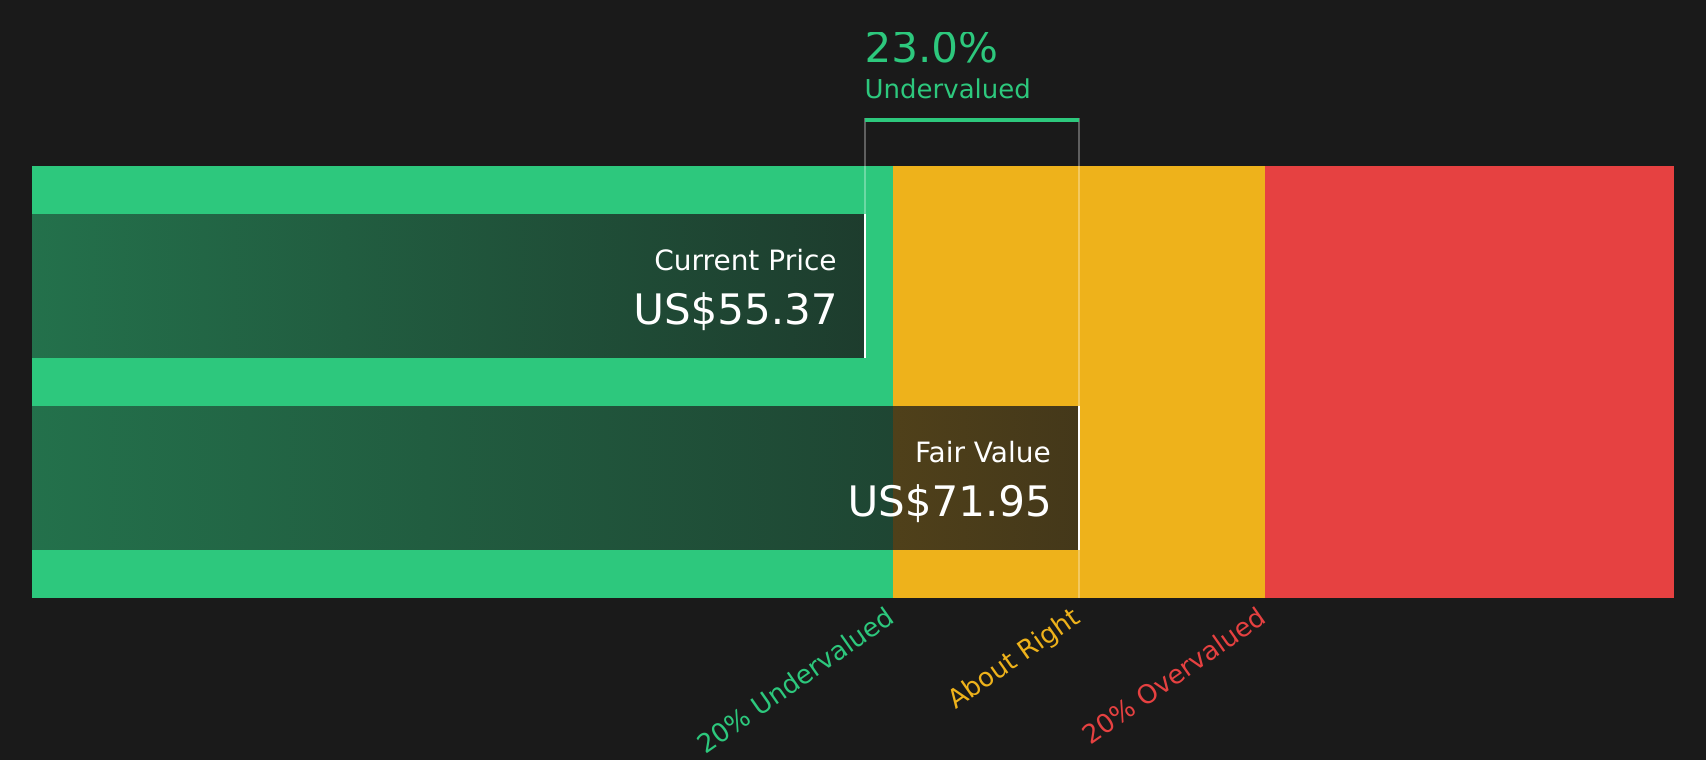
- Investors may be wondering if Main Street Capital at around US$50.71 is offering fair value right now, or if the current price is out of line with its fundamentals.
- The stock is down 0.8% over the past week, 9.1% over the past month, and 17.9% year to date, while the 3 year and 5 year returns sit at 59.0% and 77.3% respectively.
- Recent commentary around business development companies and income focused funds has put fresh attention on dividend sustainability, payout policies, and the role of interest rates, which all influence how investors think about Main Street Capital. At the same time, broader market discussions on yield oriented stocks have added extra context to recent share price moves.
- Main Street Capital currently has a valuation score of 3/6. The next sections will walk through how different valuation methods assess the stock, and finish by looking at a way to tie those numbers together into a clearer long term view.
Approach 1: Main Street Capital Excess Returns Analysis
The Excess Returns model looks at how effectively a company uses shareholder capital, comparing the return it earns to the return investors require. If the company earns more than the required return, the difference is called an excess return and is added to the value of its equity base.
For Main Street Capital, book value is $33.46 per share, with a stable book value estimate of $30.57 per share, based on the median of the past 5 years. Stable EPS is modeled at $3.51 per share, sourced from weighted future return on equity estimates from 4 analysts. The cost of equity is put at $2.84 per share, which implies an excess return of $0.67 per share. That is alongside an average return on equity of 11.47%.
Using these inputs, the Excess Returns model arrives at an intrinsic value of about $42.15 per share. Compared with the recent share price around $50.71, this implies the stock trades roughly 20.3% above this estimate, suggesting Main Street Capital may be overvalued on this approach.
Result: OVERVALUED
Our Excess Returns analysis suggests Main Street Capital may be overvalued by 20.3%. Discover 47 high quality undervalued stocks or create your own screener to find better value opportunities.
Approach 2: Main Street Capital Price vs Earnings
For profitable companies, the P/E ratio is a straightforward way to connect what you pay for a stock to the earnings it generates per share. It is widely used because it links directly to the earnings that support dividends and potential reinvestment.
What counts as a “normal” P/E often reflects how the market views a company’s growth outlook and risk. Higher expected growth or lower perceived risk can justify a higher multiple, while slower growth or higher risk usually lines up with a lower one.
Main Street Capital currently trades on a P/E of 11.06x. That sits below the Capital Markets industry average P/E of 39.26x and below the peer average of 16.52x. Simply Wall St’s “Fair Ratio” for Main Street Capital is 11.50x, which is designed to be more tailored than a simple peer or industry comparison because it incorporates factors such as earnings growth, profit margins, industry, market cap and risk profile.
Comparing the Fair Ratio of 11.50x with the actual P/E of 11.06x suggests the stock is somewhat below that tailored estimate. This points to Main Street Capital being modestly undervalued on this approach.
Result: UNDERVALUED

P/E ratios tell one story, but what if the real opportunity lies elsewhere? Start investing in legacies, not executives. Discover our 20 top founder-led companies.
Upgrade Your Decision Making: Choose your Main Street Capital Narrative
Earlier it was mentioned that there is an even better way to understand valuation. Narratives give you a simple story behind the numbers by linking your view on Main Street Capital’s future revenue, earnings and margins to a financial forecast and fair value, all through an easy tool on Simply Wall St’s Community page. Millions of investors use it to compare their own Fair Value to the current price, see how that differs from others, and watch those Narratives update automatically as new earnings or news arrive. One investor might build a more cautious Narrative around lower earnings of about $311.6 million and a lower fair value, while another builds a more optimistic Narrative using earnings closer to $473.4 million and a higher fair value. Each investor can then turn their story into a clear decision framework on whether the current price looks attractive or not based on their assumptions.
Do you think there's more to the story for Main Street Capital? Head over to our Community to see what others are saying!

This article by Simply Wall St is general in nature. We provide commentary based on historical data and analyst forecasts only using an unbiased methodology and our articles are not intended to be financial advice. It does not constitute a recommendation to buy or sell any stock, and does not take account of your objectives, or your financial situation. We aim to bring you long-term focused analysis driven by fundamental data. Note that our analysis may not factor in the latest price-sensitive company announcements or qualitative material. Simply Wall St has no position in any stocks mentioned.