

Is It Time To Reassess RLI (RLI) After A 27% Share Price Slide?
RLI Corp. RLI | 0.00 |
- If you are trying to work out whether RLI is attractively priced or not, it helps to line up the recent share performance with what the underlying valuation is actually saying.
- The stock recently closed at US$52.56, with the share price up 3.4% over the past week, down 15.9% year to date, and down 26.8% over the last year.
- Recent coverage has focused on how RLI fits into the broader insurance sector and how investors are reassessing risk and return for insurers in general. This context is important when thinking about whether the recent share price moves reflect company specific factors or wider sentiment toward insurance stocks.
- RLI currently has a valuation score of 1 out of 6. The next step is to walk through the main valuation approaches used to arrive at that result and then finish with a way of looking at value that ties all of those methods together.
RLI scores just 1/6 on our valuation checks. See what other red flags we found in the full valuation breakdown.
Approach 1: RLI Excess Returns Analysis
The Excess Returns model looks at how effectively RLI turns shareholder capital into profits above its own cost of equity, then uses that gap to estimate what the stock could be worth today.
RLI has a book value of $19.54 per share and a stable book value estimate of $19.59 per share, based on weighted future book value estimates from 7 analysts. On this equity base, the stock is expected to generate stable EPS of $2.72 per share, sourced from weighted future return on equity estimates from 8 analysts. That implies an average return on equity of 13.89%.
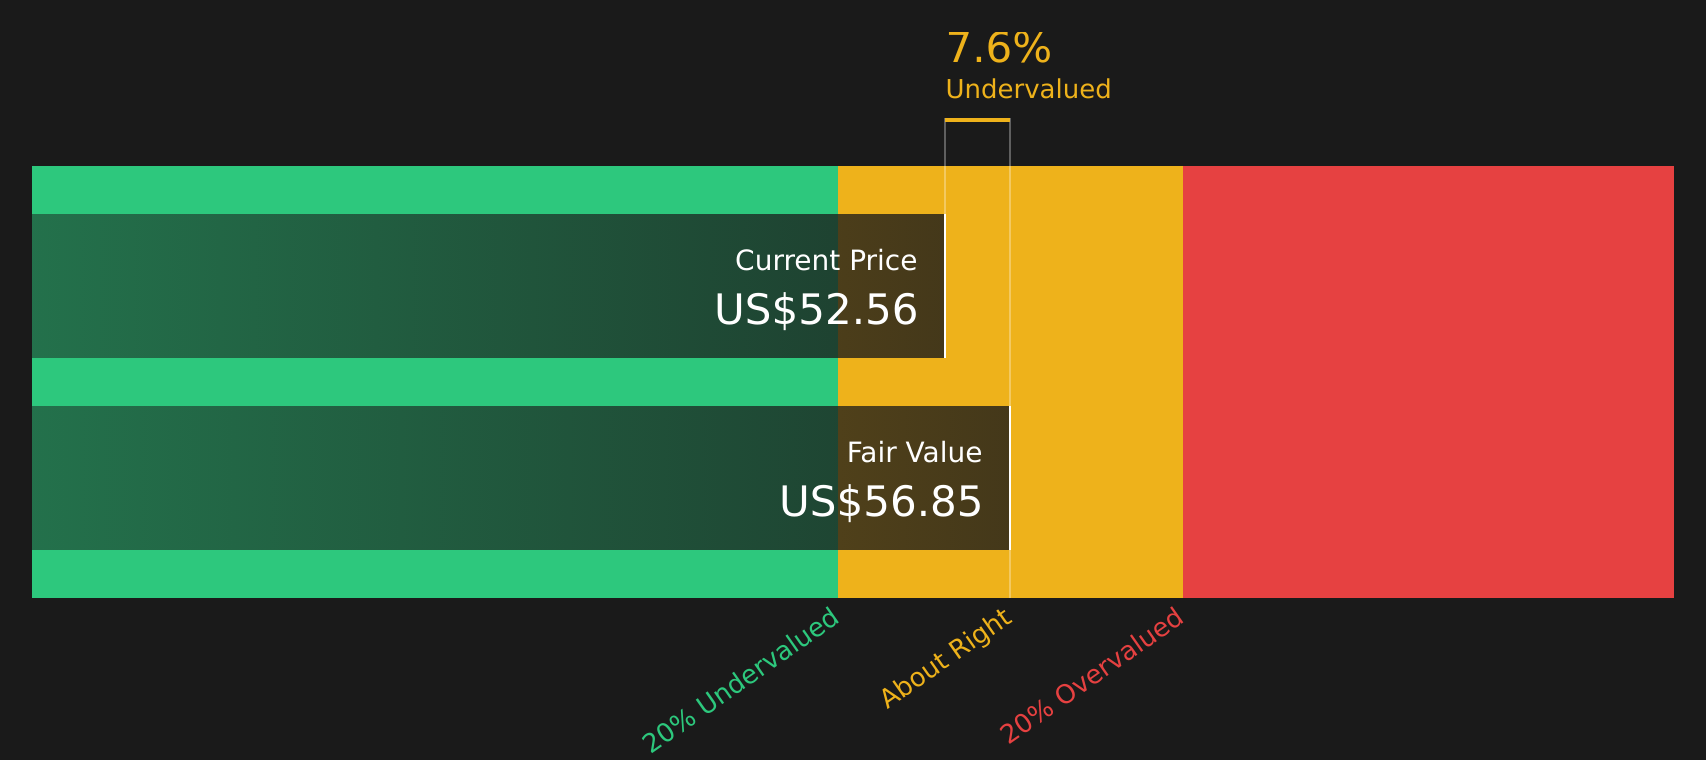
The model compares this return to a cost of equity of $1.39 per share, which leads to an excess return of $1.33 per share. Simply Wall St then capitalizes these excess returns over time to arrive at an estimated intrinsic value of about $56.85 per share.
Compared with the recent share price of $52.56, this Excess Returns estimate suggests the stock is trading at roughly a 7.6% discount, which is a relatively small gap.
Result: ABOUT RIGHT
RLI is fairly valued according to our Excess Returns, but this can change at a moment's notice. Track the value in your watchlist or portfolio and be alerted on when to act.
Approach 2: RLI Price vs Earnings
For a profitable company like RLI, the P/E ratio is a useful shorthand for how much you are paying for each dollar of current earnings. It links directly to what the business is earning today, which most investors find easier to interpret than more complex cash flow models.
What counts as a “normal” P/E depends on how the market views a company’s earnings growth prospects and risk. Higher expected growth or lower perceived risk can justify a higher P/E, while slower growth or higher risk tends to line up with a lower multiple.
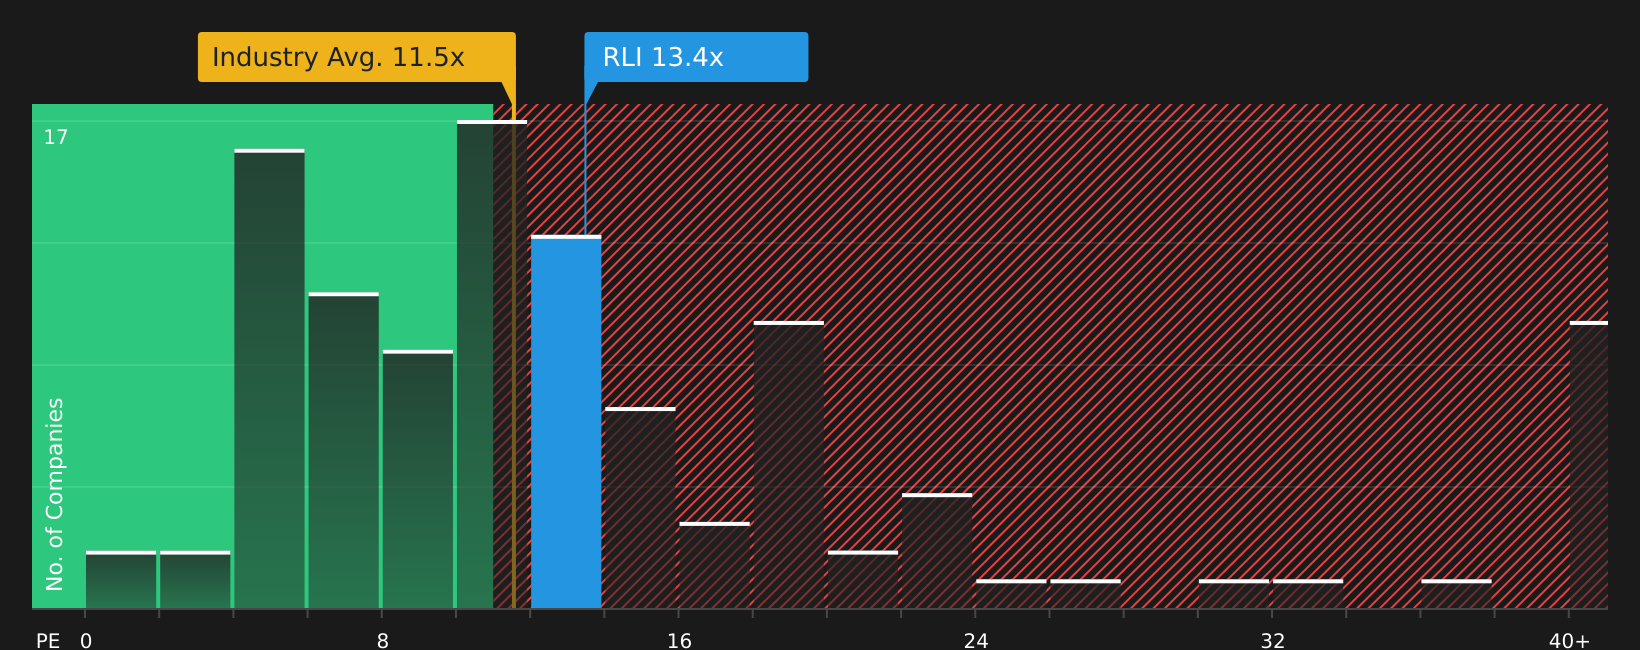
RLI currently trades on a P/E of 12.23x. That sits slightly above the Insurance industry average P/E of 11.29x and above a peer group average of 9.67x. Simply Wall St’s Fair Ratio for RLI is 8.56x, which is its proprietary estimate of what the P/E might be given factors such as earnings growth, industry, profit margin, market cap and risks.
This Fair Ratio aims to be more tailored than simple peer or industry comparisons because it adjusts for company specific characteristics rather than relying only on averages. Comparing 12.23x to the Fair Ratio of 8.56x suggests the stock is trading above that customized benchmark.
Result: OVERVALUED
P/E ratios tell one story, but what if the real opportunity lies elsewhere? Start investing in legacies, not executives. Discover our 20 top founder-led companies.
Upgrade Your Decision Making: Choose your RLI Narrative
Earlier it was mentioned that there is an even better way to understand valuation. Meet Narratives, a simple tool on Simply Wall St’s Community page that lets you link your view of RLI’s story to a concrete forecast for future revenue, earnings and margins, then to a Fair Value you can compare with the current price, all updated automatically as new news or earnings arrive. For example, one bearish RLI Narrative currently anchors on a Fair Value of US$51 while a bullish one sits at US$67. By seeing both side by side you can decide which story about RLI’s future feels more realistic and what that implies for your own buy, hold or sell timing.
For RLI however we will make it really easy for you with previews of two leading RLI Narratives:
Fair value in this bullish narrative: US$67.00 per share.
Implied discount to this fair value based on the recent US$52.56 close: about 21.6% below the narrative fair value.
Revenue growth assumption in this narrative model: 95%.
- Focuses on RLI leaning into niche and specialty lines where fewer insurers are active, with analysts in this camp expecting that focus to support the current bullish fair value.
- Builds on analyst assumptions that margins moderate from today’s level but that RLI still earns US$322.3m by about May 2029, with a higher future P/E multiple of 23.5x applied to those earnings.
- Highlights both the upside case and the key risks, including catastrophe exposure, competition in specialty lines, and the need for technology and cost investments to pay off.
Fair value in this bearish narrative: US$51.00 per share.
Implied premium to this fair value based on the recent US$52.56 close: about 3.1% above the narrative fair value.
Revenue growth assumption in this narrative model: 11%.
- Frames RLI as facing pressure from climate driven catastrophe losses, higher reinsurance and operating costs, and tougher competition across key specialty segments.
- Assumes earnings step down to US$221.4m by about May 2029 and applies a higher future P/E of 26.1x to reach a US$51.00 fair value that sits below the current share price.
- Still acknowledges positives such as underwriting discipline, specialty diversification and technology investment, but sees these as already reflected in valuation with limited additional upside.
If you want to test which of these stories feels closer to your own view and see how the market is pricing other companies on similar metrics, it can help to look beyond a single stock and compare across a broader list of companies using a structured screener such as the solid balance sheet and fundamentals stocks screener (46 results).
Do you think there's more to the story for RLI? Head over to our Community to see what others are saying!

This article by Simply Wall St is general in nature. We provide commentary based on historical data and analyst forecasts only using an unbiased methodology and our articles are not intended to be financial advice. It does not constitute a recommendation to buy or sell any stock, and does not take account of your objectives, or your financial situation. We aim to bring you long-term focused analysis driven by fundamental data. Note that our analysis may not factor in the latest price-sensitive company announcements or qualitative material. Simply Wall St has no position in any stocks mentioned.