Is It Time To Reassess Royal Gold (RGLD) After Recent Share Price Pullback
Royal Gold, Inc. RGLD | 0.00 |
- If you are wondering whether Royal Gold's current share price reflects its underlying value, this article walks through the key numbers that can help you form an informed view.
- The stock closed at US$232.62, with returns of 5.2% year to date and 31.3% over 1 year, while the last 30 days show a 10.8% decline and the last 7 days a 0.3% decline.
- Recent coverage has focused on Royal Gold's long term share price performance and how it compares with the broader materials sector. This helps frame the stronger multi year returns against shorter term pullbacks. Other commentary has highlighted how investor sentiment toward precious metals related stocks can change quickly when macro headlines or commodity prices move.
- Royal Gold currently has a valuation score of 2 out of 6. Next comes a look at what different valuation methods say about the stock today, followed by a final section on a broader way to think about valuation beyond any single model.
Royal Gold scores just 2/6 on our valuation checks. See what other red flags we found in the full valuation breakdown.
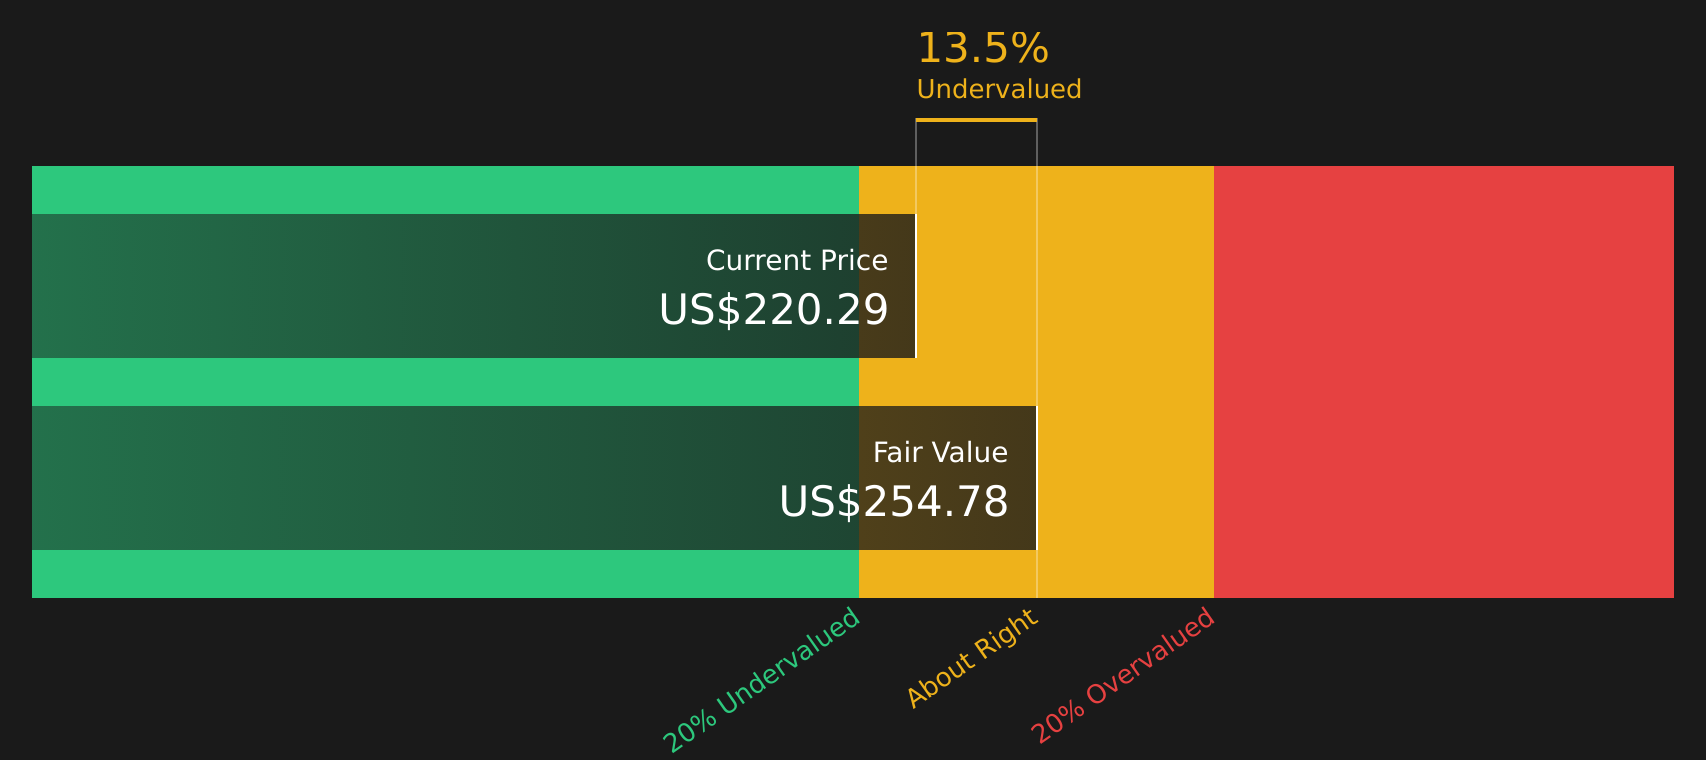
Approach 1: Royal Gold Discounted Cash Flow (DCF) Analysis
A Discounted Cash Flow model estimates what a stock could be worth by projecting the company’s future cash flows and discounting them back to today’s value. It focuses on cash generated for shareholders rather than accounting earnings.
For Royal Gold, the model used is a 2 Stage Free Cash Flow to Equity approach. The latest twelve month free cash flow is about $236.3 million. Analyst inputs and extrapolated estimates point to free cash flow of around $1.49 billion in 2028, with a detailed path laid out for the years in between. Simply Wall St extends analyst estimates beyond their usual horizon to build a full 10 year projection in this model.
After discounting these projected cash flows, the DCF model arrives at an estimated intrinsic value of about $263.50 per share. Compared with the recent share price of $232.62, this implies Royal Gold trades at an 11.7% discount to that DCF estimate. On this specific cash flow view, the stock appears to be undervalued.
Result: UNDERVALUED
Our Discounted Cash Flow (DCF) analysis suggests Royal Gold is undervalued by 11.7%. Track this in your watchlist or portfolio, or discover 51 more high quality undervalued stocks.
Approach 2: Royal Gold Price vs Earnings
For a profitable company, the P/E ratio is a straightforward way to see how much you are paying for each dollar of earnings. It links the share price directly to current profitability, which many investors use as a quick yardstick when comparing stocks.
What counts as a normal or fair P/E depends on what the market expects for growth and how risky those earnings appear. Higher expected growth or lower perceived risk can support a higher P/E, while slower growth or higher risk usually points to a lower one.
Royal Gold currently trades on a P/E of 31.11x. This is above the Metals and Mining industry average of 19.44x and above the peer average of 18.65x. Simply Wall St also calculates a Fair Ratio for Royal Gold of 26.60x, which is the P/E level suggested by factors such as its earnings growth profile, profit margin, industry, market cap and risk characteristics.
This Fair Ratio is more tailored than a simple peer or industry comparison because it adjusts for company specific features rather than assuming all miners deserve the same multiple. Comparing 31.11x with the Fair Ratio of 26.60x, the stock screens as overvalued on this metric.
Result: OVERVALUED

P/E ratios tell one story, but what if the real opportunity lies elsewhere? Start investing in legacies, not executives. Discover our 18 top founder-led companies.
Upgrade Your Decision Making: Choose your Royal Gold Narrative
Earlier it was mentioned that there is an even better way to understand valuation. Narratives give you a clear story behind the numbers by letting you tie your view of Royal Gold’s future revenue, earnings and margins to a forecast and then to a Fair Value that you can compare with today’s share price, all inside Simply Wall St’s Community page where millions of investors share and update their views as fresh news or earnings arrive. A bullish Royal Gold Narrative might lean toward the higher analyst Fair Value around US$356.00, with assumptions like faster revenue growth and resilient margins linked to acquisitions such as Sandstorm Gold and Horizon Copper. A more cautious Narrative could sit closer to the lower analyst target of US$246.00, with softer expectations for project delivery and metal prices. By choosing which story feels more realistic to you, the Fair Value that follows from that Narrative becomes a practical yardstick for considering whether the current price looks attractive or stretched.
Do you think there's more to the story for Royal Gold? Head over to our Community to see what others are saying!

This article by Simply Wall St is general in nature. We provide commentary based on historical data and analyst forecasts only using an unbiased methodology and our articles are not intended to be financial advice. It does not constitute a recommendation to buy or sell any stock, and does not take account of your objectives, or your financial situation. We aim to bring you long-term focused analysis driven by fundamental data. Note that our analysis may not factor in the latest price-sensitive company announcements or qualitative material. Simply Wall St has no position in any stocks mentioned.