Is It Time To Reassess SolarEdge Technologies (SEDG) After Major Share Price Swings?
SolarEdge Technologies, Inc. SEDG | 0.00 |
- Wondering whether SolarEdge Technologies at around US$41.58 is a bargain or a value trap? This article focuses on what the current share price might be implying about the company.
- The stock has had a mixed run, with a 12.2% decline over the last 7 days and an 18.6% decline over the last 30 days, yet it is still up 32.6% year to date and 231.6% over the last year. The 3 year and 5 year returns stand at 85.2% and 80.6% declines respectively.
- Recent commentary around SolarEdge has centered on its sharp share price swings, as investors reassess the balance between its long term potential and the risks reflected in those multi year losses. Headlines have also focused on how quickly sentiment can change in solar and semiconductor related names, which helps explain why short term moves can look very different from the longer term record.
- Right now SolarEdge has a valuation score of 3 out of 6. The next sections will walk through what that means across different valuation methods, and then finish with a way to tie those models together into a fuller view of what the stock might be worth.
Approach 1: SolarEdge Technologies Discounted Cash Flow (DCF) Analysis
A Discounted Cash Flow, or DCF, model takes projected future cash flows and discounts them back to today’s value, aiming to estimate what a business might be worth based on the cash it could generate for shareholders.
For SolarEdge Technologies, the model used is a 2 Stage Free Cash Flow to Equity approach, working off last twelve month free cash flow of about $28.7 million. Analysts and extrapolated estimates point to free cash flow reaching $224 million by 2030, with a detailed path that includes projections such as $116.9 million in 2026 and $202.3 million in 2035, all expressed in today’s terms using discounting.
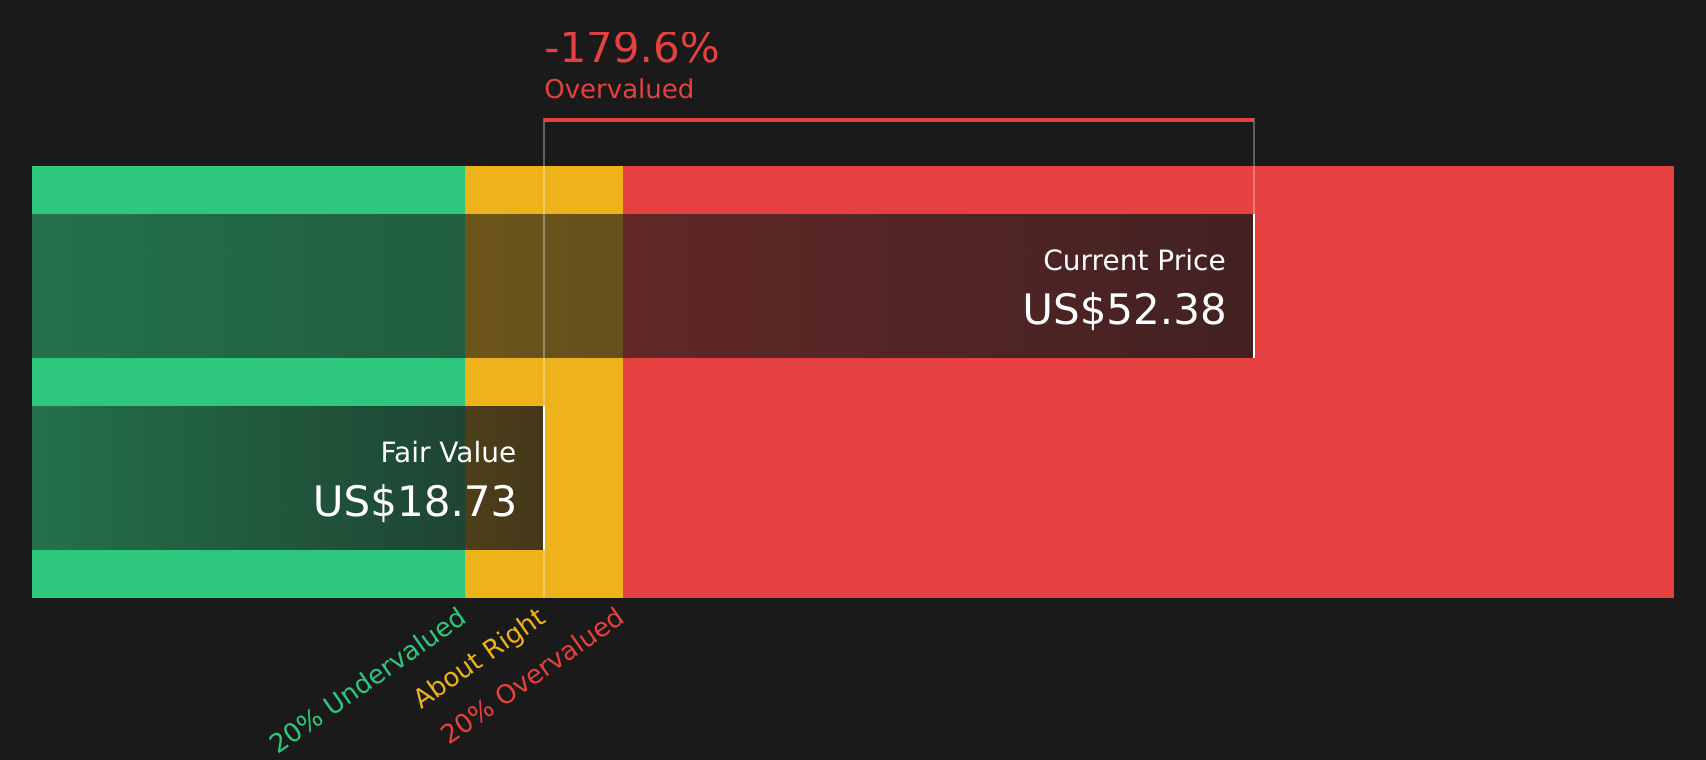
Using these cash flows, Simply Wall St’s DCF output suggests an estimated intrinsic value of about $23.97 per share. Compared with a current share price around $41.58, this implies the stock is about 73.5% above this DCF estimate, indicating a relatively rich valuation on this cash flow view alone.
Result: OVERVALUED
Our Discounted Cash Flow (DCF) analysis suggests SolarEdge Technologies may be overvalued by 73.5%. Discover 53 high quality undervalued stocks or create your own screener to find better value opportunities.
Approach 2: SolarEdge Technologies Price vs Sales
For companies where earnings are weak or volatile, the P/S ratio is often a useful way to think about valuation because it focuses on revenue rather than profits, which can swing around with investment cycles and one off items.
What counts as a reasonable P/S depends a lot on how quickly investors expect revenue to grow and how risky they see those future sales as being. Higher growth and lower perceived risk can support a higher multiple, while slower growth or higher uncertainty usually call for a lower one.
SolarEdge currently trades on a P/S of 2.14x. That sits well below the Semiconductor industry average P/S of 7.29x and also below the peer group average of 16.60x. Simply Wall St’s Fair Ratio of 2.40x is a proprietary estimate of what P/S might make sense for SolarEdge given its growth profile, margins, risks, industry and market cap, rather than just copying what peers trade on.
Because the Fair Ratio of 2.40x is modestly above the current 2.14x, this framework suggests the shares are undervalued on a sales based view.
Result: UNDERVALUED

P/S ratios tell one story, but what if the real opportunity lies elsewhere? Start investing in legacies, not executives. Discover our 18 top founder-led companies.
Upgrade Your Decision Making: Choose your SolarEdge Technologies Narrative
Earlier it was mentioned that there is an even better way to understand valuation. Narratives on Simply Wall St let you turn your view of SolarEdge Technologies into a clear story that connects your assumptions about future revenue, earnings and margins to a forecast, a Fair Value and a simple comparison with today’s price. All of this is available within an easy tool on the Community page that updates automatically when new news or earnings arrive. You can see, for example, how one investor might build a cautious SolarEdge view around a Fair Value near US$25.59, while another builds a more optimistic story closer to US$46.88. You can then quickly judge whether either story makes sense for you by comparing each Fair Value to the current share price.
For SolarEdge Technologies however we will make it really easy for you with previews of two leading SolarEdge Technologies Narratives:
Fair Value: US$46.88
Implied pricing vs this Fair Value: about 11.3% below that Fair Value at the last close of US$41.58
Revenue growth assumption: 27.34% a year
- This view assumes U.S. manufacturing credits and exports support stronger free cash flow and margins over time.
- It builds on the idea that products like Nexis and broader energy solutions help regain market share and support higher earnings by 2029.
- It treats recent analyst price target upgrades and a Fair Value near US$46.88 as broadly consistent with a recovery in margins and returns.
Fair Value: US$25.59
Implied pricing vs this Fair Value: about 62.6% above that Fair Value at the last close of US$41.58
Revenue growth assumption: 4.80% a year
- This view highlights reliance on U.S. tax credits, potential policy shifts and tariff risk as key threats to margins and earnings stability.
- It assumes slower top line growth and only moderate improvement in profitability, even by 2029.
- It aligns with a Fair Value of about US$25.59, which is well below the current share price and reflects cautious views on how durable recent improvements may be.
If you want to see how these bullish and bearish cases are built in full, and what other investors are assuming for SolarEdge's margins and growth, it is worth reviewing the full narratives next.
To see how these results tie into long-term growth, risks, and valuation, check out the full range of community narratives for SolarEdge Technologies on Simply Wall St. Add the company to your watchlist or portfolio so you'll be alerted when the story evolves.
Do you think there's more to the story for SolarEdge Technologies? Head over to our Community to see what others are saying!

This article by Simply Wall St is general in nature. We provide commentary based on historical data and analyst forecasts only using an unbiased methodology and our articles are not intended to be financial advice. It does not constitute a recommendation to buy or sell any stock, and does not take account of your objectives, or your financial situation. We aim to bring you long-term focused analysis driven by fundamental data. Note that our analysis may not factor in the latest price-sensitive company announcements or qualitative material. Simply Wall St has no position in any stocks mentioned.