Is It Time To Reassess St. Joe (JOE) After Its Strong 1 Year Share Price Gain
St. Joe Company JOE | 0.00 |
- If you are wondering whether St. Joe at around US$64.57 is pricing in too much optimism or still offers room for value, the key is to look past the headline share price and focus on what different valuation methods say.
- The stock has been relatively steady in the very short term, with a 0.1% return over the last 7 days and a decline of 0.8% over the last 30 days, while still showing a 38.5% return over the past year and 8.0% year to date.
- Recent coverage around St. Joe has centered on the stock's longer term track record, with 3 year returns of 46.1% and 5 year returns of 49.2% being used as context for current pricing. This has kept attention on whether the valuation still lines up with the fundamentals after those gains.
- Right now, St. Joe has a valuation score of 2 out of 6. This suggests some checks point to the stock being undervalued while others do not. The next sections will compare different valuation approaches and then finish with a framework that can help you interpret them more effectively.
St. Joe scores just 2/6 on our valuation checks. See what other red flags we found in the full valuation breakdown.
Approach 1: St. Joe Discounted Cash Flow (DCF) Analysis
A Discounted Cash Flow, or DCF, model takes estimates of the cash St. Joe could generate in the future and discounts those amounts back to today, to arrive at an estimate of what the stock might be worth right now.
St. Joe’s latest twelve month Free Cash Flow is about $196.8 million. Using a 2 Stage Free Cash Flow to Equity model, cash flows are projected each year and then discounted. For example, the model uses estimated Free Cash Flow of $244.6 million in 2026 and $514.7 million in 2035, with intermediate years in between and later years extrapolated by Simply Wall St after the period where analyst estimates are typically available.
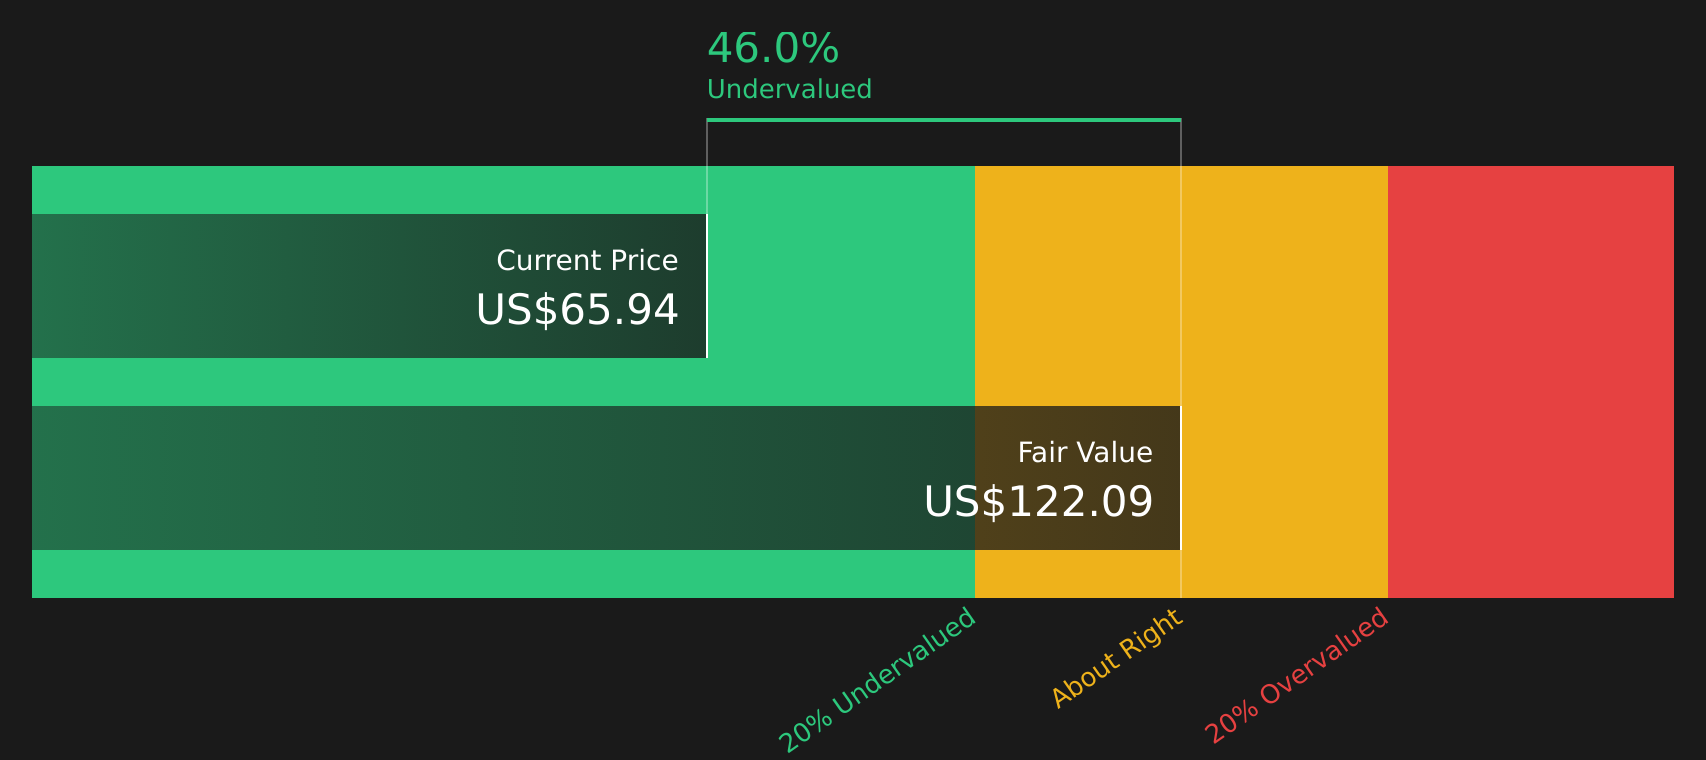
Putting all of those discounted cash flows together gives an estimated intrinsic value of $123.78 per share. Compared with the recent share price of about $64.57, the DCF output suggests the stock is trading at a 47.8% discount to this intrinsic value, which indicates it is undervalued according to this method.
Result: UNDERVALUED
Our Discounted Cash Flow (DCF) analysis suggests St. Joe is undervalued by 47.8%. Track this in your watchlist or portfolio, or discover 48 more high quality undervalued stocks.
Approach 2: St. Joe Price vs Earnings (P/E)
For a profitable company like St. Joe, the P/E ratio is a useful way to see how much you are paying for each dollar of current earnings. Investors typically accept a higher P/E when they expect stronger growth or see the business as lower risk, and look for a lower P/E when growth expectations are modest or risks feel higher.
St. Joe currently trades on a P/E of 33.07x. That sits above the Real Estate industry average P/E of 28.33x, and also above the peer group average of 16.88x, which indicates the stock is priced more expensively than these broad benchmarks.
Simply Wall St also uses a proprietary “Fair Ratio” for the preferred multiple. This is the P/E that would be expected once factors like earnings growth profile, industry, profit margins, market cap and specific risks are taken into account. Because it is tailored to St. Joe’s characteristics, this Fair Ratio can be more informative than simply comparing the stock with an industry or peer average that may contain very different companies. In this case, the Fair Ratio for St. Joe is not available, so no firm conclusion can be drawn from this method alone.
Result: ABOUT RIGHT

P/E ratios tell one story, but what if the real opportunity lies elsewhere? Start investing in legacies, not executives. Discover our 20 top founder-led companies.
Upgrade Your Decision Making: Choose your St. Joe Narrative
Earlier it was mentioned that there is an even better way to understand valuation. Meet Narratives, a simple framework that lets you attach a clear story about St. Joe’s future to the numbers you see on screen, including your assumed fair value and your expectations for revenue, earnings and margins.
A Narrative connects what you believe about the business, such as how its projects might develop or how its costs might behave, to a financial forecast and then to a fair value that you can compare with today’s share price.
On Simply Wall St, Narratives sit inside the Community page and are used by millions of investors as an accessible tool that updates when new information like news or earnings becomes available, so your view of fair value moves as the facts change.
By comparing the Fair Value from a Narrative with the current price, some St. Joe investors may see a large margin of safety while others, using more cautious assumptions, may see limited upside and prefer to wait.
Do you think there's more to the story for St. Joe? Head over to our Community to see what others are saying!

This article by Simply Wall St is general in nature. We provide commentary based on historical data and analyst forecasts only using an unbiased methodology and our articles are not intended to be financial advice. It does not constitute a recommendation to buy or sell any stock, and does not take account of your objectives, or your financial situation. We aim to bring you long-term focused analysis driven by fundamental data. Note that our analysis may not factor in the latest price-sensitive company announcements or qualitative material. Simply Wall St has no position in any stocks mentioned.