Is It Time To Reassess STAAR Surgical (STAA) After The Alcon Agreement Update
STAAR Surgical Company STAA | 26.50 | +0.23% |
- If you are asking whether STAAR Surgical's current share price lines up with its underlying worth, the recent moves in the stock make that question especially timely.
- The shares last closed at US$25.21, with returns of 24.7% over the past week, 46.3% over the past month, 6.8% year to date, and 61.9% over one year, set against declines of 62.5% over three years and 79.0% over five years.
- This mix of strong shorter term returns and weaker longer term results means recent news and changing expectations are front of mind for many investors. Understanding what has shifted around STAAR Surgical recently is important context before looking at what the current price might imply about the company.
- Despite this performance pattern, STAAR Surgical currently holds a valuation score of 0 out of 6. The rest of this article will compare different valuation methods to explain that score and then return to a more complete way to think about what the stock might be worth.
STAAR Surgical scores just 0/6 on our valuation checks. See what other red flags we found in the full valuation breakdown.
Approach 1: STAAR Surgical Discounted Cash Flow (DCF) Analysis
A Discounted Cash Flow, or DCF, model estimates what a company could be worth by projecting its future cash flows and discounting them back to today’s value.
For STAAR Surgical, the model used is a 2 Stage Free Cash Flow to Equity approach. The latest twelve month free cash flow is a loss of about US$47.2 million. Analysts provide explicit free cash flow estimates up to 5 years, and the projections out to 2035 are then extrapolated by Simply Wall St. Within these projections, free cash flow for 2030 is expected at US$53.65 million, with intermediate years stepping up from lower levels.
When all those projected cash flows are discounted back and aggregated, the DCF model arrives at an estimated intrinsic value of about US$23.63 per share. Compared with the recent share price of US$25.21, this implies STAAR Surgical trades at roughly a 6.7% premium to the model’s estimate, so it appears only slightly overvalued on this basis.
Result: ABOUT RIGHT
STAAR Surgical is fairly valued according to our Discounted Cash Flow (DCF), but this can change at a moment's notice. Track the value in your watchlist or portfolio and be alerted on when to act.
Approach 2: STAAR Surgical Price vs Sales
For companies where earnings are weak or volatile, price based on sales is often more useful than profit based metrics like P/E. The P/S ratio compares what the market is paying for each dollar of revenue, which can be easier to interpret when margins are still developing.
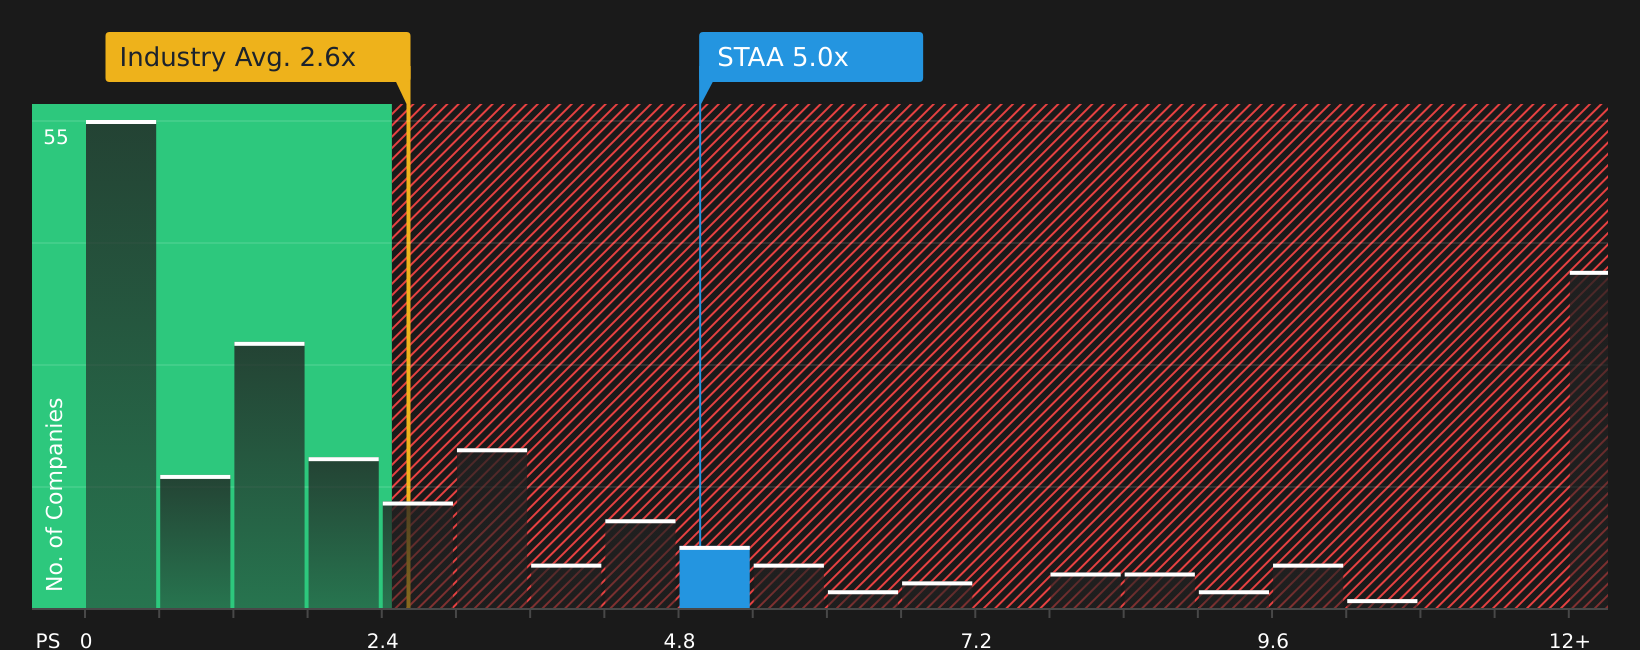
In general, higher growth expectations and lower perceived risk can support a higher “normal” or “fair” P/S ratio, while slower growth and higher risk usually point to a lower one. STAAR Surgical currently trades on a P/S of 5.21x. That is above the Medical Equipment industry average of 2.66x and above the peer average of 2.78x, so on simple comparisons the shares look expensive.
Simply Wall St’s Fair Ratio framework goes a step further by estimating what P/S multiple might be reasonable for STAAR Surgical specifically, given factors such as its earnings growth profile, industry, profit margins, market cap and risk indicators. This proprietary Fair Ratio for STAAR Surgical is 3.24x, which is higher than the industry and peer averages, but still below the current 5.21x. On this basis, the stock appears priced above what the model suggests as a fair level.
Result: OVERVALUED
P/S ratios tell one story, but what if the real opportunity lies elsewhere? Start investing in legacies, not executives. Discover our 19 top founder-led companies.
Upgrade Your Decision Making: Choose your STAAR Surgical Narrative
Earlier it was mentioned that there is an even better way to understand valuation, so this is where Narratives come in, letting you attach a clear story about STAAR Surgical to hard numbers like your assumed fair value and expectations for revenue, earnings and margins, then automatically turning that story into a forecast and a fair value estimate that you can compare with today’s price.
On Simply Wall St’s Community page, Narratives are an accessible tool used by millions of investors that link a company’s story to a financial model. When you look at STAAR Surgical you can see, for example, one bullish Narrative that ties a fair value of US$23.00 to assumptions about revenue of US$389.6 million and earnings of US$51.8 million by 2029, alongside a more cautious Narrative that points to a fair value of US$13.00 based on revenue of US$321.5 million and earnings of US$6.0 million, helping you judge whether you think those stories and fair values make sense next to the current share price.
Because Narratives update automatically when new information such as news, earnings or guidance is added to the platform, you can quickly see how the implied fair value for STAAR Surgical is shifting and use that to decide whether the current market price is above or below the story you find most reasonable.
For STAAR Surgical, however, we'll make it really easy for you with previews of two leading STAAR Surgical Narratives:
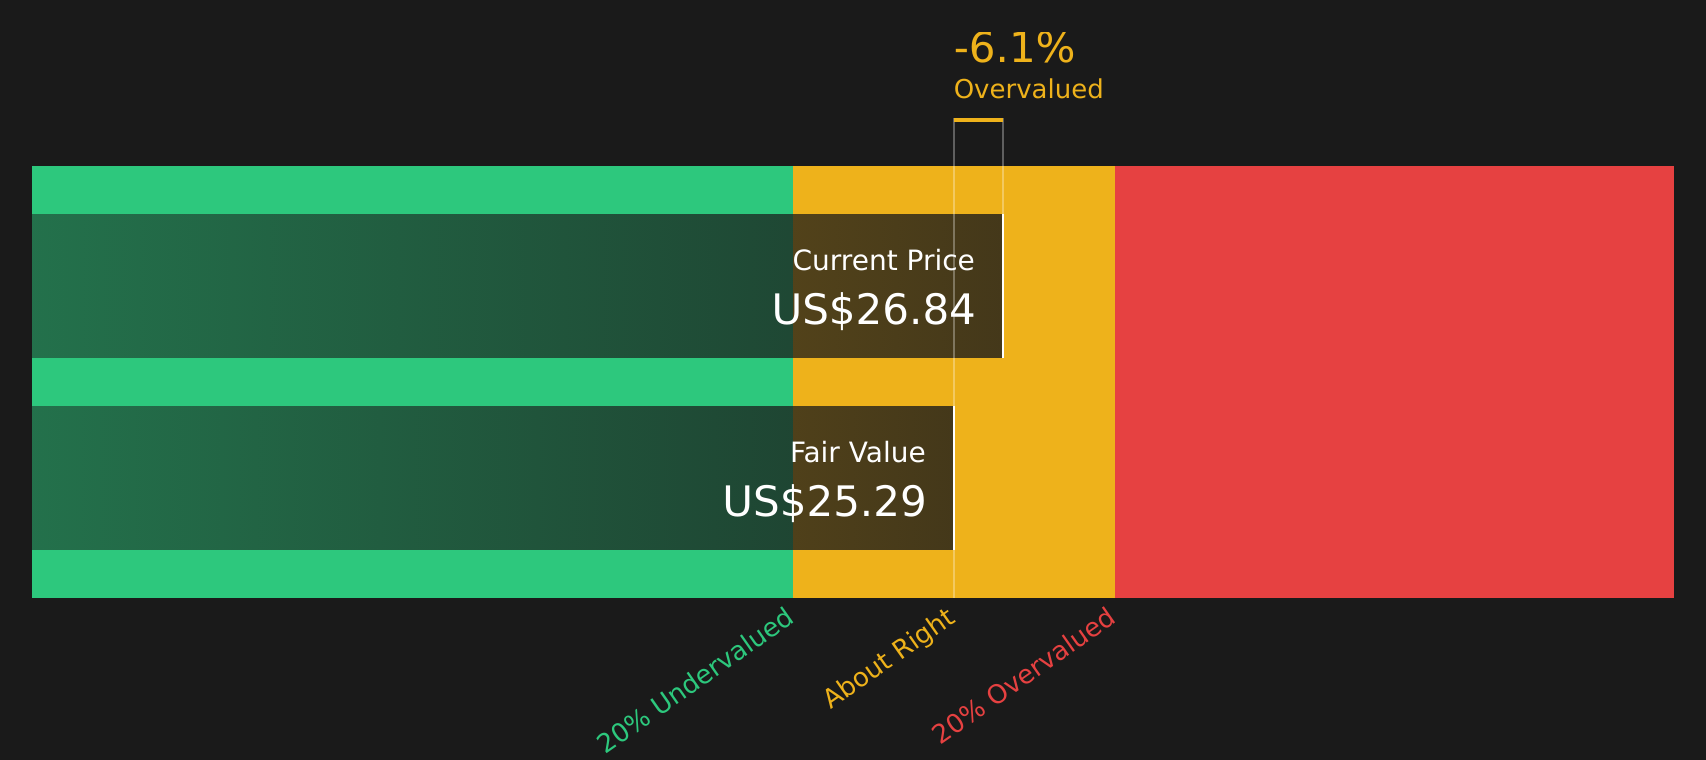
Fair value: US$26.56 per share
Implied pricing gap vs last close: about 5.1% below this fair value
Revenue growth assumption: 16.09%
- Analysts building this Narrative are assuming annual revenue growth a little above 16%, with profit margins moving into positive low single digits.
- The story leans on STAAR Surgical having no debt and a cash rich balance sheet, which gives room to manage through China related headwinds while still funding selective growth projects.
- Key swing factors include how quickly China demand and inventory return to balance, the outcome of the amended Alcon deal process, and whether margin improvement actually tracks the current model.
Fair value: US$23.00 per share
Implied pricing gap vs last close: about 9.6% above this fair value
Revenue growth assumption: 17.61%
- This Narrative assumes solid double digit revenue growth and a move to mid teens profit margins, but still lands on a fair value below the current share price.
- It flags concentration in implantable lenses, exposure to regulation and reimbursement in key markets such as China, and rising competition as the main reasons to be cautious about how much to pay for that growth.
- It also raises longer term questions around shifts in eye care needs toward cataract related procedures, which may not fully align with STAAR Surgical’s current focus.
If you want to go beyond the previews and see how other investors are joining the dots between these stories, valuations, and the latest news, See what the community is saying about STAAR Surgical.
Do you think there's more to the story for STAAR Surgical? Head over to our Community to see what others are saying!

This article by Simply Wall St is general in nature. We provide commentary based on historical data and analyst forecasts only using an unbiased methodology and our articles are not intended to be financial advice. It does not constitute a recommendation to buy or sell any stock, and does not take account of your objectives, or your financial situation. We aim to bring you long-term focused analysis driven by fundamental data. Note that our analysis may not factor in the latest price-sensitive company announcements or qualitative material. Simply Wall St has no position in any stocks mentioned.