Is It Time To Reassess TechnipFMC (FTI) After Its Recent Multi Year Rally?
TechnipFMC plc FTI | 0.00 |
- If you are trying to figure out whether TechnipFMC stock offers good value at today’s price, the recent share performance and current valuation metrics give you a lot to work with.
- The stock last closed at US$73.94, with returns of 56.3% year to date, 155.1% over 1 year, and a very large gain over 5 years, set against a 4.0% decline over the past week and a 3.3% return over the last 30 days.
- Recent coverage has focused on TechnipFMC’s position within the energy services sector and its projects pipeline. This helps explain why investors have been reassessing the stock’s risk and return profile, and these news items give context to the strong multi year share price gains and the shorter term pullback.
- TechnipFMC currently holds a value score of 2 out of 6. This raises useful questions about how standard models, market pricing and a broader business view line up, and it sets the stage for looking at different valuation approaches before finishing with a more complete way to think about what the stock might be worth.
TechnipFMC scores just 2/6 on our valuation checks. See what other red flags we found in the full valuation breakdown.
Approach 1: TechnipFMC Discounted Cash Flow (DCF) Analysis
A DCF model takes estimates of the cash TechnipFMC could generate in the future and discounts those cash flows back to today, aiming to translate the long term stream of cash into a single value per share.
For TechnipFMC, the model uses a 2 Stage Free Cash Flow to Equity approach based on cash flow projections. The latest twelve month free cash flow stands at about $1.35b. Analyst and extrapolated estimates see free cash flow figures such as $1.33b in 2026 and $1.75b by 2030, with later years based on Simply Wall St extrapolations beyond the period covered by analysts.
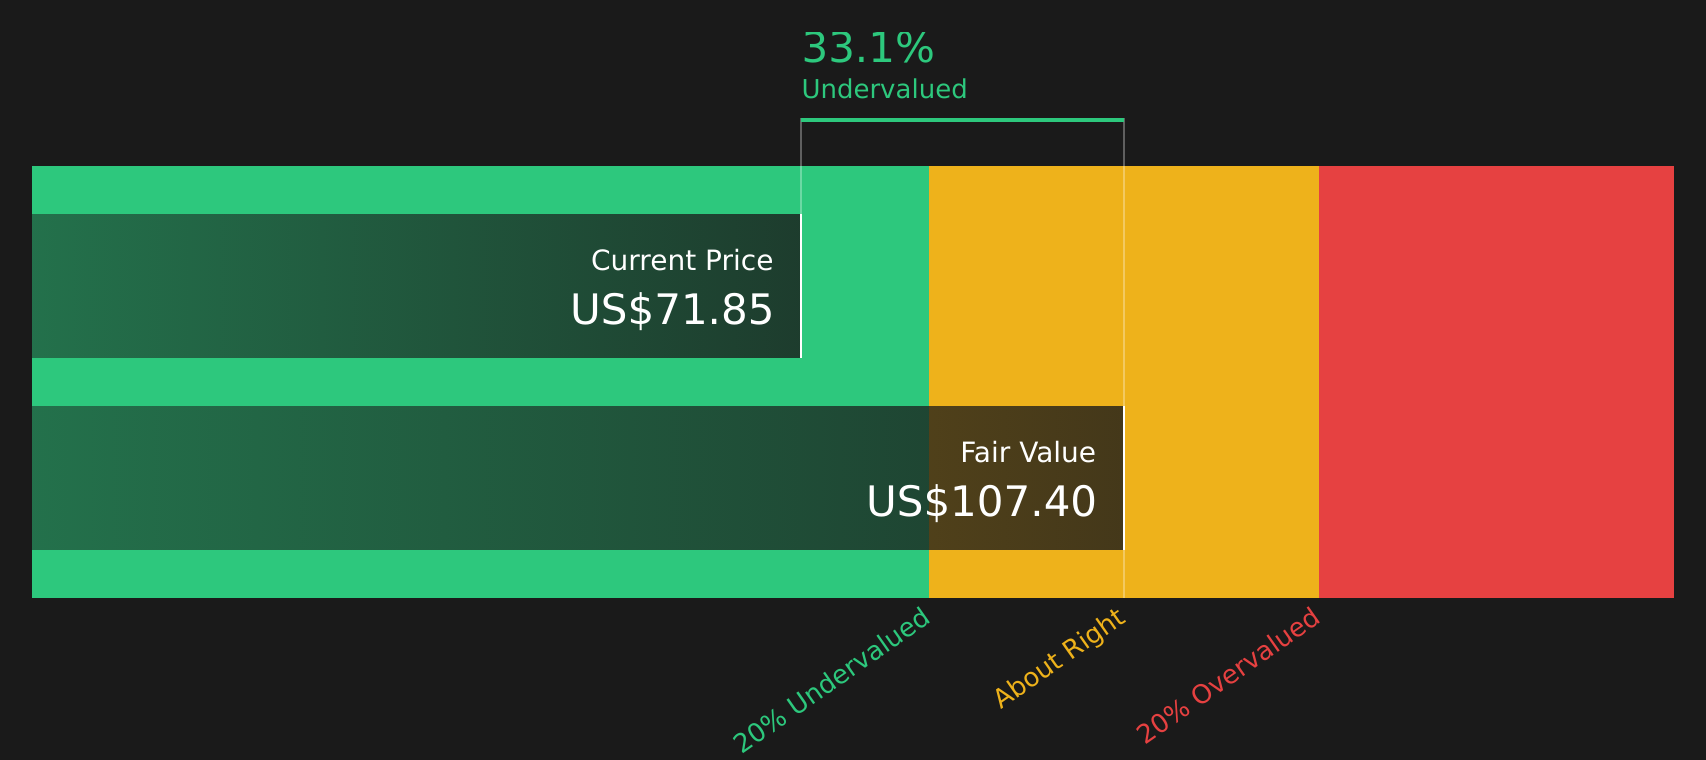
Running these projected cash flows through the DCF model results in an estimated intrinsic value of about $104.58 per share. Compared with the recent share price of $73.94, this implies a 29.3% discount, which indicates the stock appears undervalued on this cash flow based view.
Result: UNDERVALUED
Our Discounted Cash Flow (DCF) analysis suggests TechnipFMC is undervalued by 29.3%. Track this in your watchlist or portfolio, or discover 44 more high quality undervalued stocks.
Approach 2: TechnipFMC Price vs Earnings
For a profitable company, the P/E ratio is a useful shorthand for how much you are paying for each dollar of earnings. It links directly to what the business is currently earning, which many investors find easier to relate to than long range cash flow models.
What counts as a "normal" P/E depends on how the market views the company’s growth prospects and risk. Higher expected growth and lower perceived risk tend to support higher P/E multiples, while lower growth or higher risk usually justify lower ones.
TechnipFMC trades on a P/E of 27.24x, which sits close to the Energy Services industry average of 26.91x and above the peer group average of 21.19x. Simply Wall St also calculates a proprietary "Fair Ratio" of 23.61x, which estimates the P/E that might be reasonable given factors such as earnings growth, industry, profit margins, market cap and specific risks.
This Fair Ratio can be more informative than a simple comparison with peers or the broad industry, because it adjusts for the company’s own growth profile and risk characteristics rather than assuming all stocks in the sector deserve similar multiples. Set against the current 27.24x P/E, the 23.61x Fair Ratio suggests TechnipFMC may be trading a little above this modelled level.
Result: OVERVALUED

P/E ratios tell one story, but what if the real opportunity lies elsewhere? Start investing in legacies, not executives. Discover our 19 top founder-led companies.
Upgrade Your Decision Making: Choose your TechnipFMC Narrative
Earlier it was mentioned that there is an even better way to understand valuation, so this is where Narratives come in, giving you a simple story that links your view of TechnipFMC’s future revenue, earnings and margins to a forecast and then to a fair value that you can compare with the current price.
On Simply Wall St’s Community page, Narratives let you set out that story in plain language, tie it to numbers such as your assumed fair value, and then see how your view stacks up against others, all in a format that updates when new information like earnings or news is added.
For example, one TechnipFMC Narrative might lean toward the higher analyst fair value of US$83.00, based on assumptions of revenue of US$13.3b, earnings of US$1.7b and a future P/E of 20.8x. Another might sit closer to the lower fair value of US$41.37 or the bearish target of US$30.00, using more cautious revenue growth, margins and a lower earnings base. This gives you a clear sense of how different stories lead to different fair values relative to the current price.
For TechnipFMC however we'll make it really easy for you with previews of two leading TechnipFMC Narratives:
Think of these as ready made storylines that connect the same business data to different conclusions about what the stock might be worth, so you can see which one lines up more closely with your own assumptions.
Fair value in this bullish narrative: US$83.00 per share
Implied valuation gap vs last close: about 11% below that fair value
Revenue growth assumption: 10.33% a year
- Highlights an extended subsea cycle and a large pipeline of offshore and deepwater projects, including newer regions such as Guyana, Suriname, Namibia, Mozambique and Cyprus.
- Builds on expectations for higher profit margins and recurring, higher margin service revenue, supported by digitalization, automation and energy transition offerings like offshore green hydrogen and carbon capture infrastructure.
- Weights the risk that TechnipFMC remains heavily tied to long duration offshore oil and gas contracts, where regulation, carbon pricing and shorter cycle project preferences could limit growth and pressure margins over time.
Fair value in this consensus narrative: US$65.62 per share
Implied valuation gap vs last close: about 12.6% above that fair value
Revenue growth assumption: 5.77% a year
- Starts from a strong subsea position with a record order pipeline, recurring long lived service contracts and technology focused offerings in areas such as all electric subsea systems and CO2 capture.
- Assumes earnings and margins can rise, but questions whether the current share price already reflects much of that improvement, especially with slower buybacks and a required future P/E of 21.2x in the model.
- Flags longer term headwinds from decarbonization, geopolitical risk in markets like Mozambique and Nigeria, and the risk that TechnipFMC moves too slowly toward energy transition projects compared with peers.
The key takeaway is that the bullish and more cautious narratives are using different assumptions for revenue growth, margins and the P/E that might be reasonable several years from now, which leads to very different fair values relative to the current US$73.94 share price.
If you want to see how other investors are joining the dots between TechnipFMC’s subsea backlog, energy transition exposure and valuation, it is worth reading the full narratives and then stress testing the numbers against your own expectations.
To see how these results tie into long-term growth, risks, and valuation, check out the full range of community narratives for TechnipFMC on Simply Wall St. Add the company to your watchlist or portfolio so you'll be alerted when the story evolves.
Do you think there's more to the story for TechnipFMC? Head over to our Community to see what others are saying!

This article by Simply Wall St is general in nature. We provide commentary based on historical data and analyst forecasts only using an unbiased methodology and our articles are not intended to be financial advice. It does not constitute a recommendation to buy or sell any stock, and does not take account of your objectives, or your financial situation. We aim to bring you long-term focused analysis driven by fundamental data. Note that our analysis may not factor in the latest price-sensitive company announcements or qualitative material. Simply Wall St has no position in any stocks mentioned.