Is It Time To Reassess Topgolf Callaway Brands (MODG) After Its 57% One Year Rally
Topgolf Callaway Brands Corp. MODG | 0.00 |
- If you are wondering whether Topgolf Callaway Brands is attractively priced or not, this article will walk you through what the current share price could imply about value.
- The stock has been active recently, with a 16.4% return over 7 days, 19.6% over 30 days, 15.9% year to date and 57.2% over the last year, while the 3 year and 5 year returns of 39.0% and 49.8% declines show a very different experience for longer term holders.
- These recent moves sit against a backdrop of ongoing interest in experiential consumer brands and golf related spending. This can influence how investors think about companies that mix equipment, entertainment venues and lifestyle branding. Broader sector news around consumer demand, discretionary spending and leisure activity has also been in focus. This can affect how the market prices a business like Topgolf Callaway Brands even without company specific headlines.
- Right now Topgolf Callaway Brands scores 4 out of 6 on our valuation checks. This suggests several metrics point to undervaluation while others are more balanced. Next we will walk through the standard valuation approaches before finishing with a way to think about value that ties the numbers back to the broader investment story.
Approach 1: Topgolf Callaway Brands Discounted Cash Flow (DCF) Analysis
A Discounted Cash Flow, or DCF, model takes estimates of the cash a business could generate in the future and discounts those cash flows back to today to get an implied value per share.
For Topgolf Callaway Brands, the model used is a 2 Stage Free Cash Flow to Equity approach. The latest twelve month free cash flow is a loss of $67.8 million, so the starting point is negative. Looking ahead, analysts have a single explicit forecast of $342.0 million of free cash flow in 2027. Further years out to 2035 are extrapolated by Simply Wall St rather than based on additional analyst estimates.
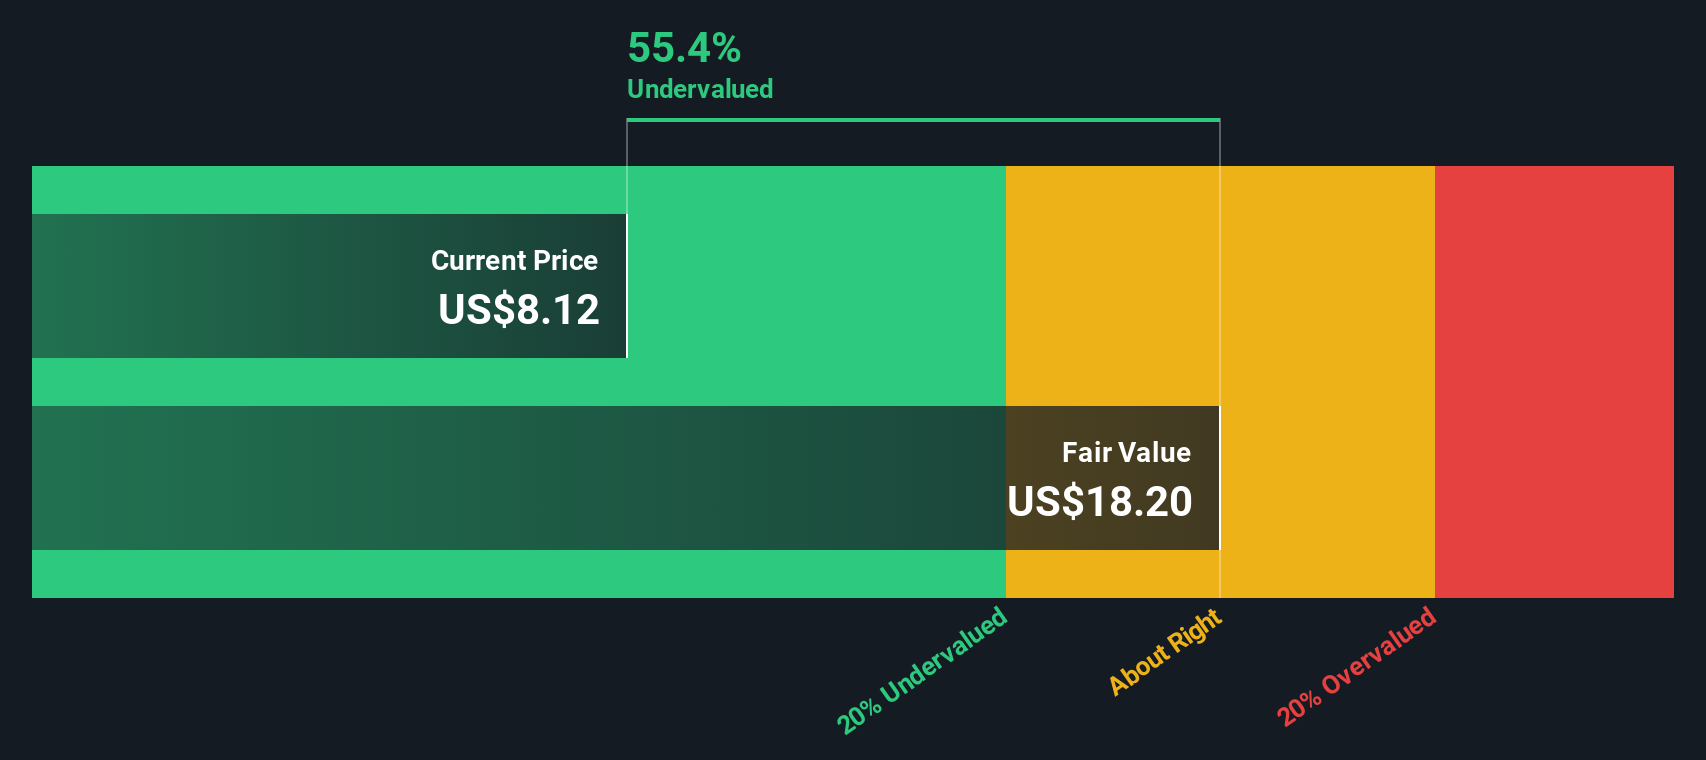
When all those projected cash flows are discounted back to today, the model arrives at an estimated intrinsic value of about $21.91 per share. Compared to the current share price, this implies the stock is 38.0% undervalued on this set of assumptions.
Result: UNDERVALUED
Our Discounted Cash Flow (DCF) analysis suggests Topgolf Callaway Brands is undervalued by 38.0%. Track this in your watchlist or portfolio, or discover 879 more undervalued stocks based on cash flows.
Approach 2: Topgolf Callaway Brands Price vs Sales
For companies where earnings can be limited or volatile, the P/S ratio is often a useful way to think about value because it focuses on revenue rather than profit, which can swing around with one off items or heavy investment.
In general, investors tend to pay higher or lower P/S multiples depending on what they expect for revenue growth and how risky they think those revenues are. Faster and more predictable growth can support a higher multiple, while slower or more uncertain growth usually lines up with a lower one.
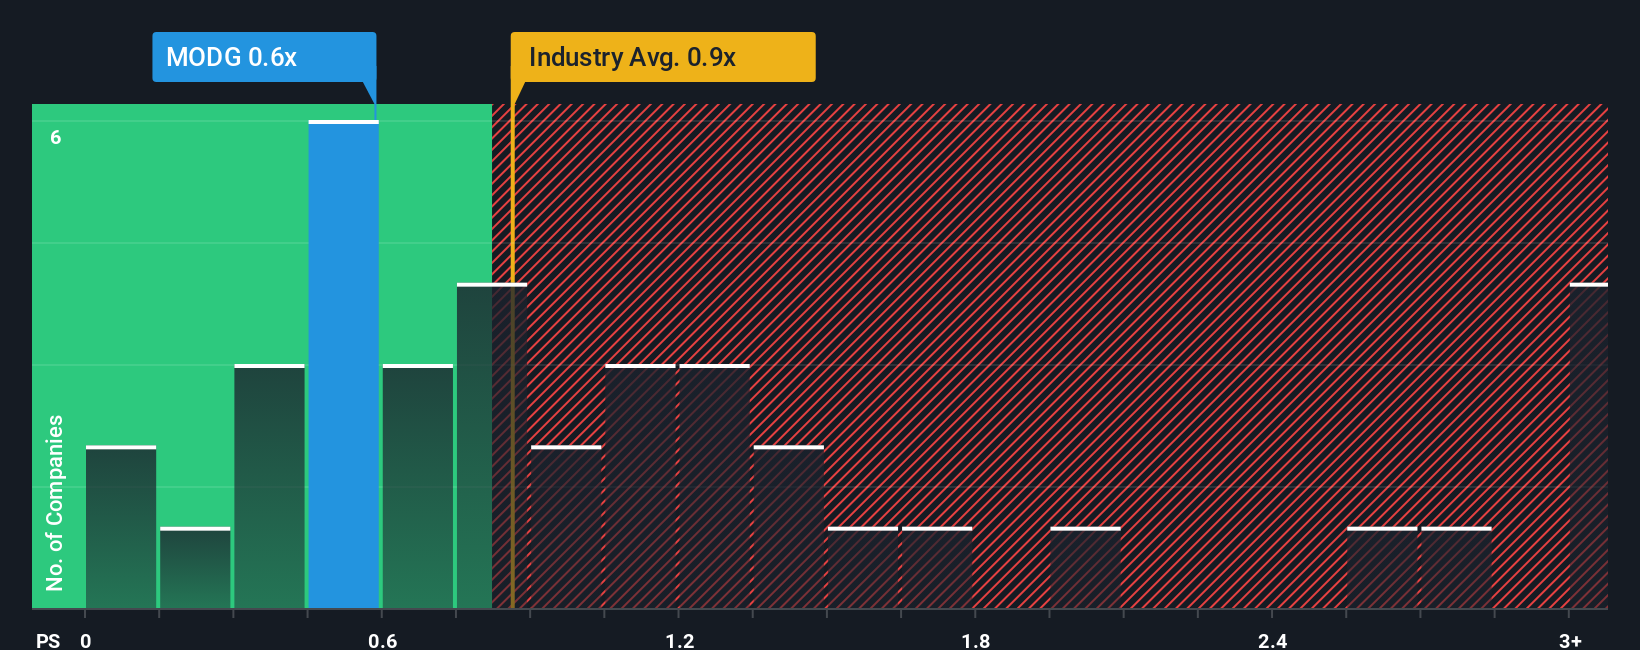
Topgolf Callaway Brands currently trades on a P/S of 0.61x. That sits below the Leisure industry average P/S of 1.01x and also below the peer group average of 1.45x. Simply Wall St’s Fair Ratio for the company is 0.16x, which is a proprietary estimate of what the P/S should be given factors like its earnings growth profile, industry, profit margins, market cap and company specific risks.
The Fair Ratio is more tailored than a simple comparison with peers or the industry because it adjusts for those business specific characteristics rather than assuming every company in the group deserves the same multiple. Comparing the Fair Ratio of 0.16x with the actual P/S of 0.61x suggests the shares trade above this modelled level.
Result: OVERVALUED
P/S ratios tell one story, but what if the real opportunity lies elsewhere? Discover 1444 companies where insiders are betting big on explosive growth.
Upgrade Your Decision Making: Choose your Topgolf Callaway Brands Narrative
Earlier we mentioned that there is an even better way to think about valuation. On Simply Wall St's Community page you can use Narratives, where you tell the story you believe about Topgolf Callaway Brands, link that story to your own revenue, earnings and margin assumptions, translate those into a fair value, and then compare that fair value with the current price to help decide whether the stock looks attractive or not. The Narrative updates automatically when fresh news or earnings arrive, so different investors can see, for example, why one holder might build a higher fair value around the US$13.00 bullish price target, another might anchor closer to the US$9.00 bearish target, or even the US$12.50 platform fair value, all inside the same simple tool.
Do you think there's more to the story for Topgolf Callaway Brands? Head over to our Community to see what others are saying!

This article by Simply Wall St is general in nature. We provide commentary based on historical data and analyst forecasts only using an unbiased methodology and our articles are not intended to be financial advice. It does not constitute a recommendation to buy or sell any stock, and does not take account of your objectives, or your financial situation. We aim to bring you long-term focused analysis driven by fundamental data. Note that our analysis may not factor in the latest price-sensitive company announcements or qualitative material. Simply Wall St has no position in any stocks mentioned.