Is It Time To Reassess Urban Outfitters (URBN) After Recent Share Price Pullback?
Urban Outfitters, Inc. URBN | 64.57 | +1.33% |
- If you are wondering whether Urban Outfitters at around US$60.93 is still attractively priced or already stretched, the starting point is to understand what the current share price actually reflects.
- The stock has seen a 1.3% decline over the last week and an 8.0% decline over the last 30 days, yet it still sits on a 16.3% one-year return and a 121.4% three-year return, which can change how investors think about both growth potential and risk.
- Recent coverage has focused on Urban Outfitters as a long-term Specialty Retail name, with attention on how its mix of brands and channels fits into broader consumer trends. This kind of context can influence how the market reacts to new information, even when there is no single headline that explains every price move.
- Right now, Urban Outfitters scores a full 6 out of 6 on Simply Wall St's valuation checks. The rest of this article will walk through key valuation approaches and then finish with a way to look beyond the numbers to understand what that score may really mean for you.
Approach 1: Urban Outfitters Discounted Cash Flow (DCF) Analysis
A Discounted Cash Flow, or DCF, model projects a company’s future cash flows and then discounts them back to today’s value using a required rate of return. The idea is simple: what matters is how much cash the business can return to shareholders over time, expressed in today’s dollars.
For Urban Outfitters, the model used is a 2 Stage Free Cash Flow to Equity approach. The latest twelve month Free Cash Flow is about US$340.4 million. Analyst inputs and Simply Wall St extrapolations then project Free Cash Flow out over ten years, with one of the later data points at US$452.93 million for 2029 and a series of discounted values through 2035.
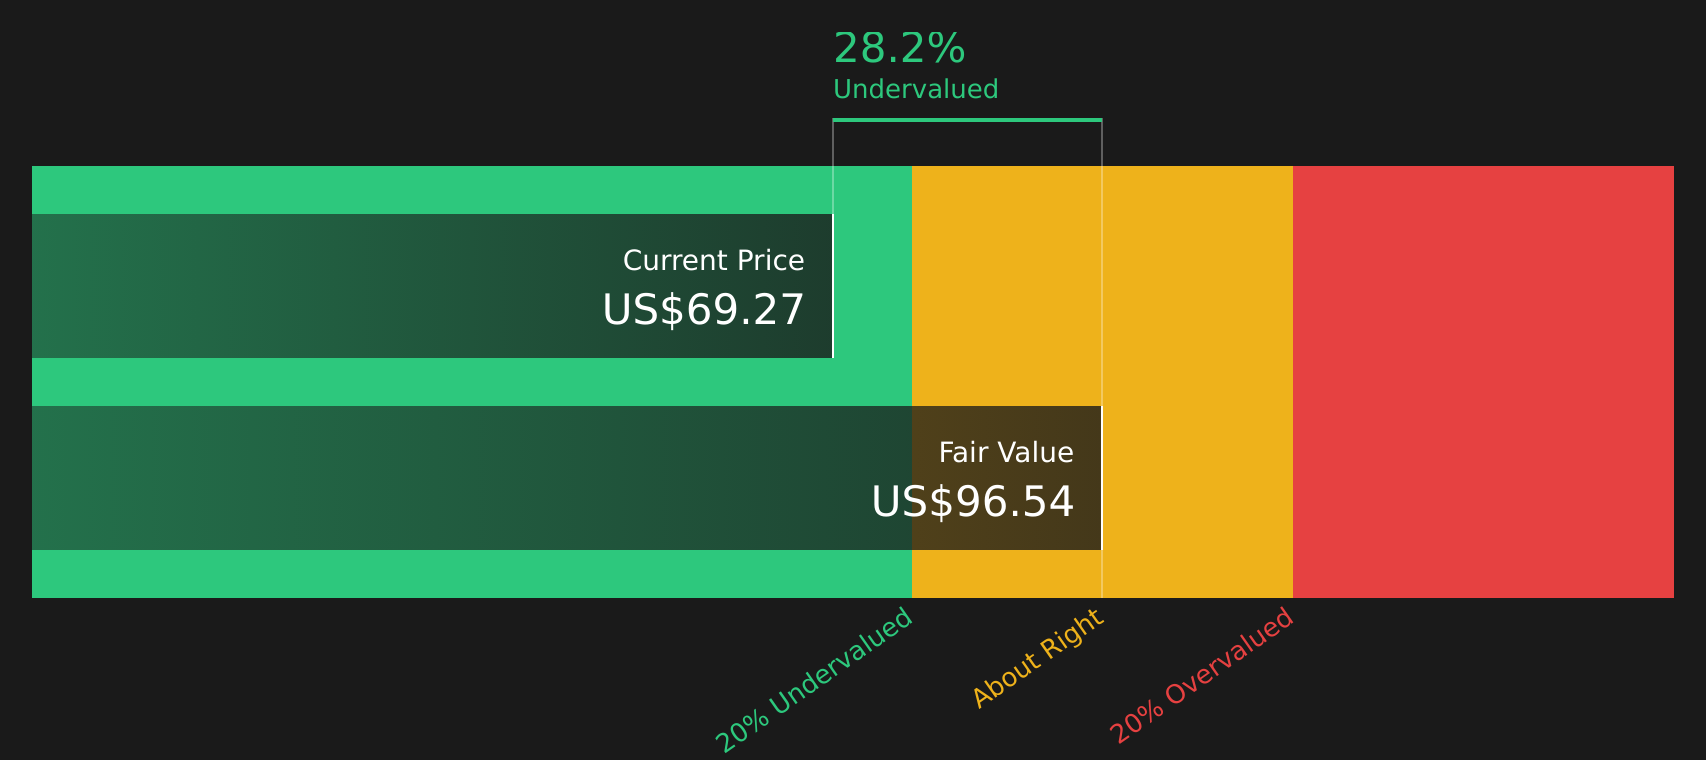
When those projected cash flows are added up and discounted, the implied intrinsic value comes out at about US$95.90 per share. Against a current share price around US$60.93, the DCF suggests the stock trades at roughly a 36.5% discount, which points to a valuation that is meaningfully below this model’s estimate of fair value.
Result: UNDERVALUED
Our Discounted Cash Flow (DCF) analysis suggests Urban Outfitters is undervalued by 36.5%. Track this in your watchlist or portfolio, or discover 62 more high quality undervalued stocks.
Approach 2: Urban Outfitters Price vs Earnings
For a profitable company like Urban Outfitters, the P/E ratio is a useful way to connect the share price with the earnings that support it. It gives you a quick sense of how much investors are paying for each dollar of profit.
What counts as a “normal” P/E ratio depends on how the market views a company’s growth potential and risk. Higher expected growth or lower perceived risk can justify a higher P/E, while slower expected growth or higher risk can point to a lower one.
Urban Outfitters currently trades on a P/E of about 11.76x. That is below the Specialty Retail industry average of about 19.34x and also below the peer group average of about 14.92x. Simply Wall St’s Fair Ratio for Urban Outfitters is 15.59x, which is its proprietary estimate of what the P/E might be given the company’s earnings growth profile, margins, industry, market cap and specific risks.
Because the Fair Ratio is tailored to Urban Outfitters, it can be more informative than simple comparisons with peers or the industry, which treat very different businesses as if they were the same. With the shares at 11.76x against a Fair Ratio of 15.59x, the multiple indicates the stock is trading below that model’s estimate of fair value.
Result: UNDERVALUED

P/E ratios tell one story, but what if the real opportunity lies elsewhere? Start investing in legacies, not executives. Discover our 20 top founder-led companies.
Upgrade Your Decision Making: Choose your Urban Outfitters Narrative
Earlier it was mentioned that there is an even better way to understand valuation. Narratives pull everything together by letting you attach your own story about Urban Outfitters to specific forecasts for revenue, earnings and margins. You can then link that story to a Fair Value and compare it with the current share price, all through an easy tool on Simply Wall St's Community page that updates as new news or earnings arrive. One investor might build a more optimistic Narrative that lines up with a Fair Value near the US$102 high analyst target, while another might prefer a more cautious Narrative closer to the US$62 low, using those different views to decide how attractive Urban Outfitters looks at today’s price.
Do you think there's more to the story for Urban Outfitters? Head over to our Community to see what others are saying!

This article by Simply Wall St is general in nature. We provide commentary based on historical data and analyst forecasts only using an unbiased methodology and our articles are not intended to be financial advice. It does not constitute a recommendation to buy or sell any stock, and does not take account of your objectives, or your financial situation. We aim to bring you long-term focused analysis driven by fundamental data. Note that our analysis may not factor in the latest price-sensitive company announcements or qualitative material. Simply Wall St has no position in any stocks mentioned.