Is It Time To Reconsider Northrop Grumman (NOC) After The Recent Share Price Pullback?
Northrop Grumman Corp. NOC | 0.00 |
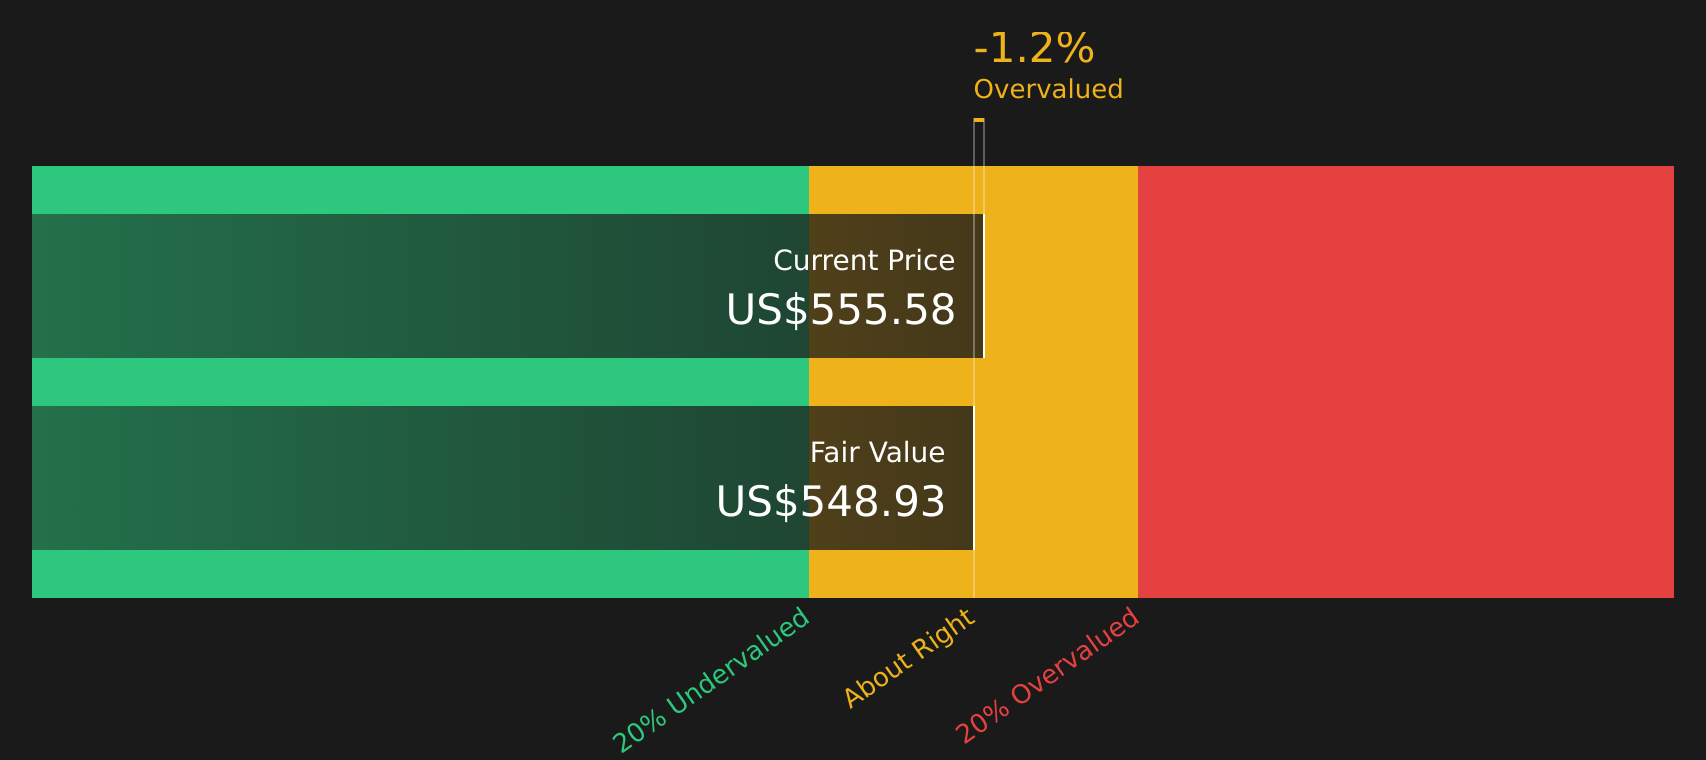
- If you are wondering whether Northrop Grumman at around US$556 per share still offers value, or if the recent run has already priced in the key strengths, this article breaks down what the current valuation implies for you.
- The stock has slipped about 0.4% over the last week and is down 16.4% over the past month and 5.0% year to date. It is still up 18.6% over the past year, 32.0% over three years, and 63.0% over five years.
- Recent coverage has focused on Northrop Grumman's role within the broader Aerospace & Defense sector and on how investor sentiment toward defense spending and major contractors has shifted over time. These headlines help frame why the share price has pulled back in the short term while still sitting on sizeable multi year gains.
- On Simply Wall St's valuation checks, Northrop Grumman scores 4 out of 6. The rest of this article will walk through what different valuation approaches suggest for the stock and then finish with a more rounded way to think about what "fair value" means in this context.
Approach 1: Northrop Grumman Discounted Cash Flow (DCF) Analysis
A Discounted Cash Flow model takes estimated future cash flows, discounts them back to today using a required return, and adds them up to get an estimate of what the business might be worth now.
For Northrop Grumman, the latest twelve month Free Cash Flow is about $2.99b. The 2 Stage Free Cash Flow to Equity model then uses analyst forecasts out to 2030 and extends them further. For example, projected Free Cash Flow is $3.35b in 2026 and $4.33b in 2030, with later years extrapolated by Simply Wall St rather than based on direct analyst estimates.
Discounting these projected cash flows back to today produces an estimated intrinsic value of about $550.38 per share. With the stock trading around $556, the DCF output suggests it is roughly 1.1% above this estimate. This points to a price that is very close to the modelled fair value rather than clearly cheap or expensive.
Result: ABOUT RIGHT
Northrop Grumman is fairly valued according to our Discounted Cash Flow (DCF), but this can change at a moment's notice. Track the value in your watchlist or portfolio and be alerted on when to act.
Approach 2: Northrop Grumman Price vs Earnings
For a profitable company like Northrop Grumman, the P/E ratio is a useful way to think about what you are paying for each dollar of earnings. In general, higher growth expectations and lower perceived risk tend to support a higher P/E, while slower expected growth or higher risk usually line up with a lower “normal” P/E range.
Northrop Grumman currently trades on a P/E of 17.27x. This sits below the Aerospace & Defense industry average P/E of about 34.21x and below the peer group average of 28.75x. On the surface, that points to a lower earnings multiple than many similar stocks.
Simply Wall St’s Fair Ratio for Northrop Grumman is 28.06x. This is a proprietary estimate of what the P/E might be given factors such as earnings growth, profit margins, industry, market cap and risk profile. Because it adjusts for these company specific drivers, the Fair Ratio can be more informative than a simple comparison with peers or the broad industry.
Comparing the current P/E of 17.27x with the Fair Ratio of 28.06x suggests the stock trades below this model based reference point.
Result: UNDERVALUED

P/E ratios tell one story, but what if the real opportunity lies elsewhere? Start investing in legacies, not executives. Discover our 19 top founder-led companies.
Upgrade Your Decision Making: Choose your Northrop Grumman Narrative
Earlier the article mentioned that there is an even better way to think about valuation, and that is Narratives. Narratives let you tell a clear story about Northrop Grumman by linking your view of its future revenue, earnings and margins to a financial forecast and a fair value. You can use an easy tool on Simply Wall St's Community page that updates as new news or earnings arrive, so you can compare that Fair Value with the live share price and act accordingly. For example, you might lean toward a higher fair value closer to US$815 based on stronger confidence in defense spending and program execution, or prefer a lower figure around US$603 if you are more cautious about contract risk and sector sentiment.
Do you think there's more to the story for Northrop Grumman? Head over to our Community to see what others are saying!

This article by Simply Wall St is general in nature. We provide commentary based on historical data and analyst forecasts only using an unbiased methodology and our articles are not intended to be financial advice. It does not constitute a recommendation to buy or sell any stock, and does not take account of your objectives, or your financial situation. We aim to bring you long-term focused analysis driven by fundamental data. Note that our analysis may not factor in the latest price-sensitive company announcements or qualitative material. Simply Wall St has no position in any stocks mentioned.