Is It Time To Reconsider Papa Johns (PZZA) After Its Recent Share Price Weakness
Papa John's International, Inc. PZZA | 0.00 |
- If you are wondering whether Papa John's International at around US$33.78 still offers value or is a value trap, the key is to look past the headline share price and into how the market is currently pricing the business.
- The stock has seen a 3.6% decline over the last 7 days, a 4.1% decline over 30 days and is down 16.2% year to date, while the 1 year return stands at 6.2%. The 3 and 5 year returns are 51.8% and 59.3% declines respectively, which can change how investors think about both risk and potential reward.
- Recent coverage has focused on how Papa John's International is repositioning its brand and operations, drawing attention to questions about whether the current share price reflects those efforts. This context helps explain why some investors are rechecking their assumptions about what the stock is really worth today.
- Simply Wall St currently gives Papa John's International a valuation score of 1 out of 6. Next you will see how different valuation approaches handle that score and, at the end of the article, a broader way to think about value beyond any single model.
Papa John's International scores just 1/6 on our valuation checks. See what other red flags we found in the full valuation breakdown.
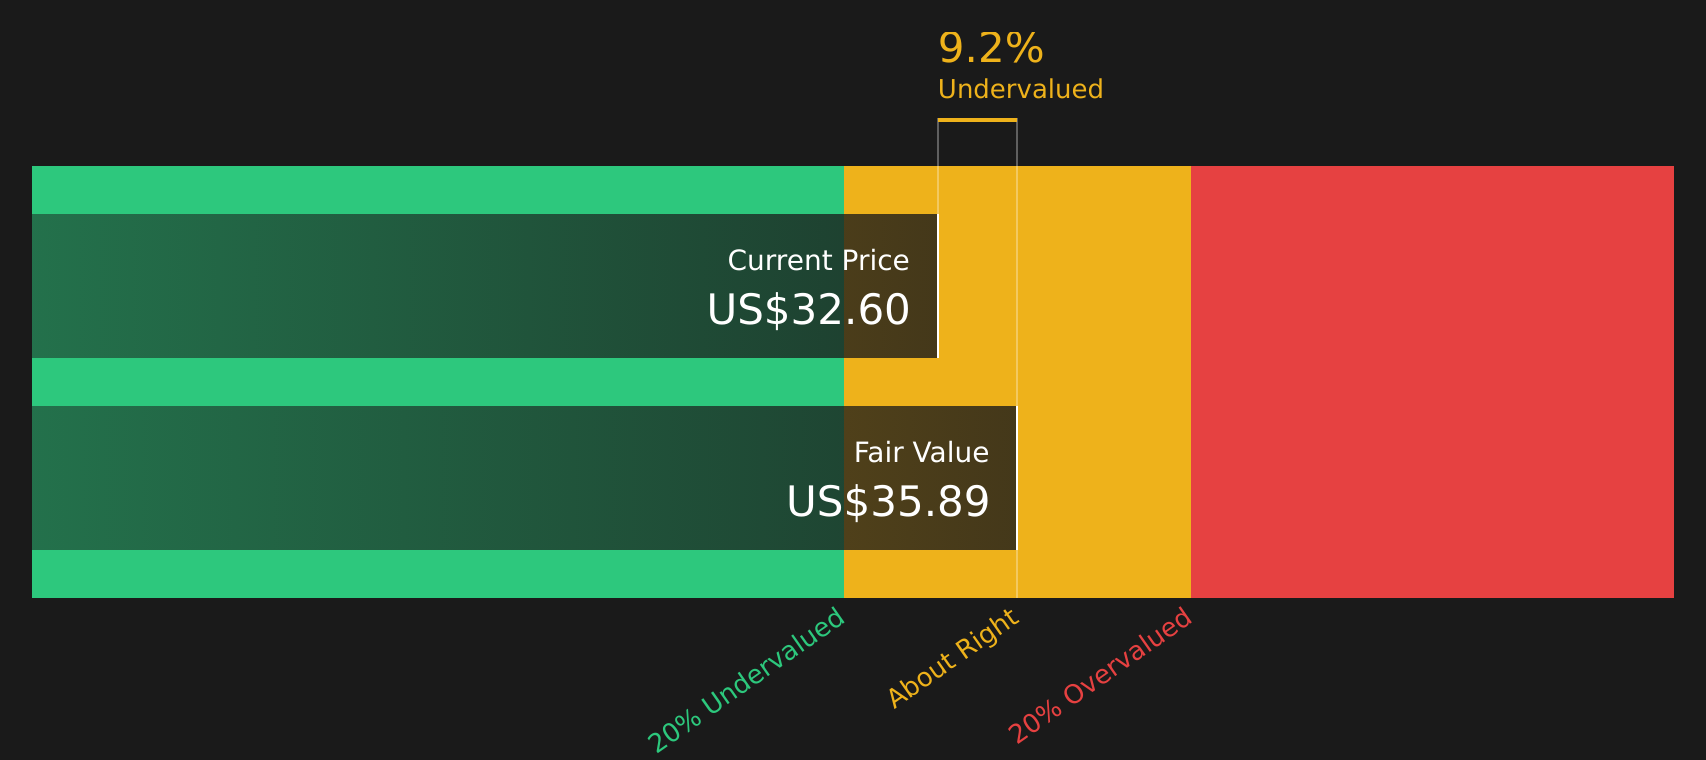
Approach 1: Papa John's International Discounted Cash Flow (DCF) Analysis
A Discounted Cash Flow, or DCF, model takes the cash that a company is expected to generate in the future and discounts those amounts back into today’s dollars to estimate what the business might be worth now.
For Papa John's International, the model starts with last twelve months Free Cash Flow of about $52.5 million and then uses analyst estimates and extrapolated forecasts to project cash flows over the next decade. For example, Simply Wall St uses analyst estimates of $73.15 million in 2026 and $82.01 million in 2027, then extends this path out to around $125.35 million by 2035, all in $ and based on a 2 Stage Free Cash Flow to Equity model.
Discounting these projected cash flows back to today gives an estimated intrinsic value of $39.45 per share. Compared with the recent share price of about $33.78, the DCF output suggests Papa John's International trades at roughly a 14.4% discount, which indicates the stock is undervalued on this model alone.
Result: UNDERVALUED
Our Discounted Cash Flow (DCF) analysis suggests Papa John's International is undervalued by 14.4%. Track this in your watchlist or portfolio, or discover 44 more high quality undervalued stocks.
Approach 2: Papa John's International Price vs Earnings
For profitable companies, the P/E ratio is a useful shorthand for how much you are paying for each dollar of current earnings. It links the share price directly to earnings today, which many investors treat as a key anchor for value.
What counts as a “normal” P/E often reflects how the market views a company’s growth potential and risk profile. Higher expected growth and lower perceived risk tend to come with higher P/E ratios, while slower growth or higher risk usually point to lower P/E levels.
Papa John's International currently trades on a P/E of 37.58x. That is higher than the Hospitality industry average of about 20.58x and also above the peer average of 19.58x. Simply Wall St’s Fair Ratio for the stock is 31.63x, which is its estimate of an appropriate P/E once factors like earnings growth, industry, profit margins, market cap and specific risks are considered.
The Fair Ratio is more tailored than a simple peer or industry comparison because it adjusts for those company specific drivers rather than assuming all Hospitality stocks deserve similar multiples. Comparing 37.58x to the Fair Ratio of 31.63x suggests the stock trades at a richer valuation than that customised benchmark.
Result: OVERVALUED

P/E ratios tell one story, but what if the real opportunity lies elsewhere? Start investing in legacies, not executives. Discover our 19 top founder-led companies.
Upgrade Your Decision Making: Choose your Papa John's International Narrative
Earlier it was mentioned that there is an even better way to understand valuation. This is where Narratives come in as a simple way for you to link your view of Papa John's International to concrete numbers and a fair value range.
A Narrative is your story for the company, written in plain language, that sits on top of your own estimates for future revenue, earnings and margins. It then connects those assumptions to a single Fair Value you can compare to the current share price.
On Simply Wall St, Narratives live in the Community page and are used by millions of investors as an accessible tool that turns these stories into full forecasts. This allows you to quickly see whether your view implies Papa John's International should trade closer to the bearish Fair Value of about US$32.00 or the more optimistic Fair Value of roughly US$49.71.
Because Narratives on the platform update as new information such as earnings or takeover headlines comes through, you can see in real time how fresh data shifts those Fair Values. This can help you decide whether the current price of around US$33.78 looks high, low or broadly aligned with the market consensus near US$37.91.
For Papa John's International, here are previews of two leading Papa John's International Narratives that may help your analysis:
Fair Value: US$49.71
Implied discount to this Fair Value versus the recent US$33.78 share price: about 32.1%.
Revenue trend used in this Narrative: 1.81% annual revenue decline over the next 3 years.
- Assumes product launches, digital personalisation and at least US$50m of cost savings by 2028 help expand margins even if revenue drifts lower.
- Builds in earnings rising from US$29.6m today to US$89.8m by about April 2029, with a future P/E of 24.6x, above the current US Hospitality industry P/E of 21.3x.
- Sees takeover interest and international growth as additional supports, while still flagging risks from health trends, input cost swings, labour inflation and store closures.
Fair Value: US$32.00
Implied premium to this Fair Value versus the recent US$33.78 share price: about 5.6%.
Revenue trend used in this Narrative: 2.47% annual revenue decline over the next 3 years.
- Frames health concerns, higher labour and food costs, and reliance on third party delivery as long term headwinds for revenue and margins.
- Uses earnings rising to US$77.6m by about May 2029 and a future P/E of 18.4x, below the current US Hospitality industry P/E of 20.8x, to reach a Fair Value around US$32.00.
- Accepts that digital tools, menu development, cost savings and loyalty programs can help, but still treats store closures and softer same store sales as reasons to be cautious on upside.
Taken together, these Narratives outline a range from about US$32.00 to roughly US$49.71 that you can use as reference points when considering whether the current price around US$33.78 aligns with your own expectations for Papa John's International's earnings, margins and risk profile.
Do you think there's more to the story for Papa John's International? Head over to our Community to see what others are saying!

This article by Simply Wall St is general in nature. We provide commentary based on historical data and analyst forecasts only using an unbiased methodology and our articles are not intended to be financial advice. It does not constitute a recommendation to buy or sell any stock, and does not take account of your objectives, or your financial situation. We aim to bring you long-term focused analysis driven by fundamental data. Note that our analysis may not factor in the latest price-sensitive company announcements or qualitative material. Simply Wall St has no position in any stocks mentioned.