Is It Time To Reconsider Royal Gold (RGLD) After The Recent Share Price Pullback
Royal Gold, Inc. RGLD | 0.00 |
- If you are wondering whether Royal Gold at around US$219.58 is offering fair value or a potential mispricing, the key is to look past the headline share price and focus on what different valuation tools are actually saying.
- The stock has pulled back in the short term, with the share price down 2.8% over the last week and 4.8% over the last month, even though the 1 year, 3 year and 5 year returns sit at 19.5%, 85.4% and 91.8% respectively.
- Recent coverage has centered on Royal Gold as a royalty and streaming company in the precious metals space. Investors are weighing its exposure to gold prices against the relative stability of its business model. Commentary has also focused on how this structure can influence cash flow resilience compared to traditional miners, which helps frame how the market is reacting to the latest price moves.
- On Simply Wall St’s valuation checks, Royal Gold records a value score of 3 out of 6. It is therefore important to compare what different valuation methods say now, and then look at an even more rounded way of thinking about valuation at the end of this article.
Approach 1: Royal Gold Discounted Cash Flow (DCF) Analysis
A Discounted Cash Flow, or DCF, model estimates what a stock could be worth by projecting the company’s future cash flows and discounting them back to today’s dollars. For Royal Gold, this is done using a 2 Stage Free Cash Flow to Equity approach, based on cash flow projections rather than earnings multiples.
Royal Gold’s last twelve months Free Cash Flow is reported at about $236.3 million. Analysts and model projections point to Free Cash Flow of around $1.23b in 2029, with a series of annual forecasts in between. Simply Wall St uses analyst estimates where available, then extends the projections further out to build a full ten year cash flow path, all in $.
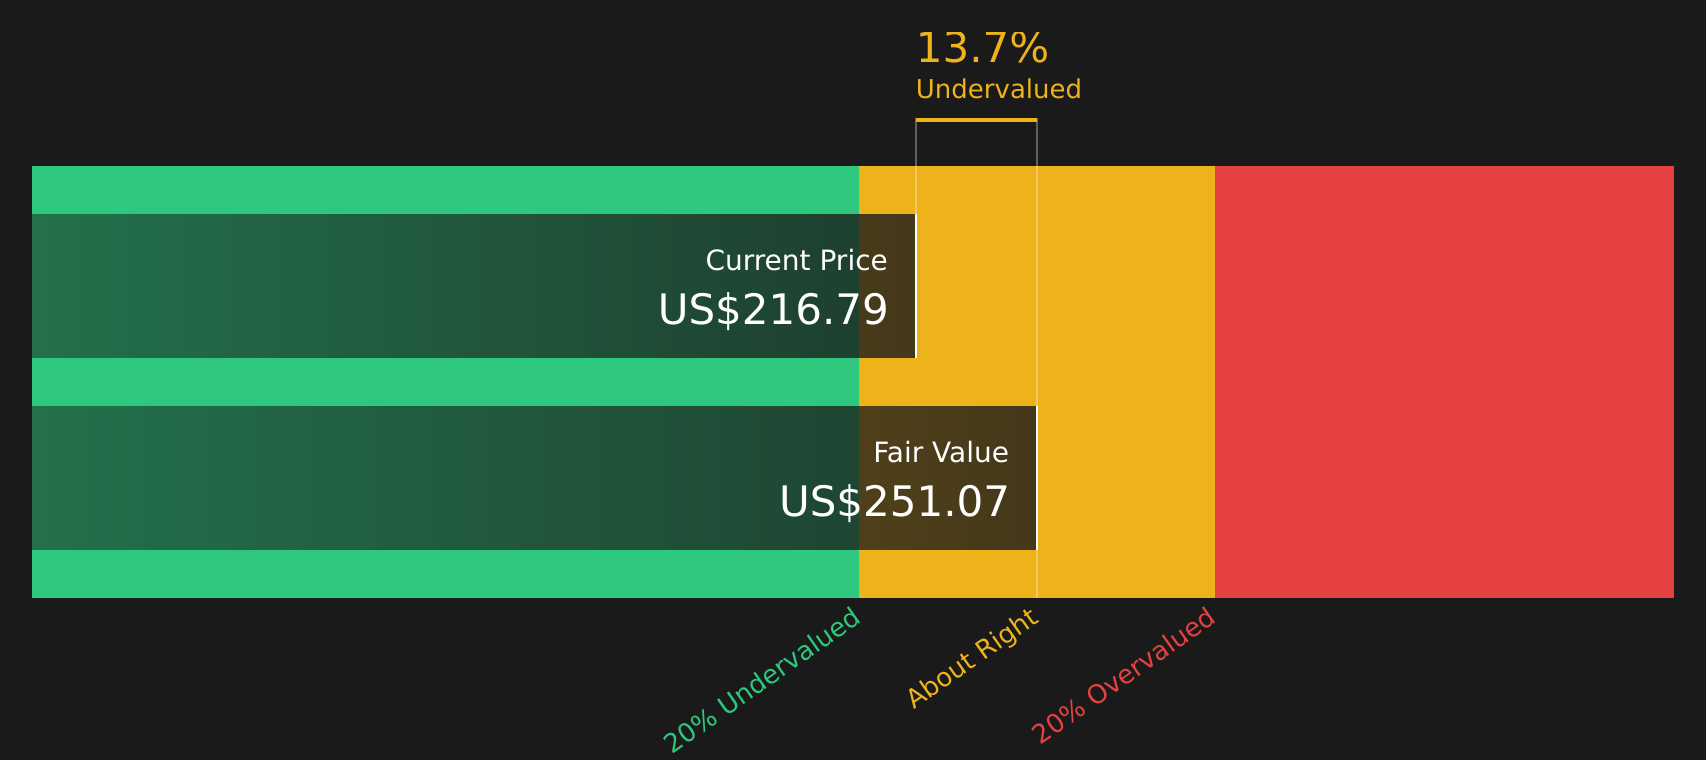
Those projected cash flows are discounted back to today to arrive at an estimated intrinsic value of about $251.20 per share. Compared to the recent share price of roughly $219.58, the DCF outcome suggests Royal Gold trades at about a 12.6% discount, which indicates the stock is currently assessed as undervalued on this model.
Result: UNDERVALUED
Our Discounted Cash Flow (DCF) analysis suggests Royal Gold is undervalued by 12.6%. Track this in your watchlist or portfolio, or discover 46 more high quality undervalued stocks.
Approach 2: Royal Gold Price vs Earnings
For profitable companies, the P/E ratio is a useful way to see how much you are paying for each dollar of earnings, because it ties directly to what the business is currently generating rather than just its assets or revenue.
What counts as a "normal" or "fair" P/E depends on how fast earnings are expected to grow and how risky those earnings are. Higher expected growth or lower perceived risk can justify a higher P/E, while slower growth or higher risk usually points to a lower one.
Royal Gold currently trades on a P/E of about 29.4x. That sits close to both the peer average of 29.7x and above the broader Metals and Mining industry average of about 22.1x.
Simply Wall St’s Fair Ratio for Royal Gold is 25.3x. This is a proprietary estimate of what the P/E "should" be, given factors such as its earnings profile, industry, profit margins, market cap and risk characteristics. Because it attempts to adjust for these company specific factors, it can be more informative than a simple comparison with peers or the industry average.
With the current P/E of 29.4x above the Fair Ratio of 25.3x, the multiple suggests the stock screens as overvalued on this measure.
Result: OVERVALUED

P/E ratios tell one story, but what if the real opportunity lies elsewhere? Start investing in legacies, not executives. Discover our 20 top founder-led companies.
Upgrade Your Decision Making: Choose your Royal Gold Narrative
Earlier it was mentioned that there is an even better way to understand valuation. Narratives on Simply Wall St let you attach your own story about Royal Gold to the numbers by linking assumptions for future revenue, earnings and margins to a Fair Value. You can then compare that Fair Value with the current price to help you decide whether to buy or sell. Each Narrative lives on the Community page, updates automatically when new earnings or news arrive, and can reflect different viewpoints, such as a more cautious investor anchoring closer to the US$246 price target while a more optimistic investor leans toward US$356. All of this is available inside an easy, guided tool used by millions of investors.
Do you think there's more to the story for Royal Gold? Head over to our Community to see what others are saying!

This article by Simply Wall St is general in nature. We provide commentary based on historical data and analyst forecasts only using an unbiased methodology and our articles are not intended to be financial advice. It does not constitute a recommendation to buy or sell any stock, and does not take account of your objectives, or your financial situation. We aim to bring you long-term focused analysis driven by fundamental data. Note that our analysis may not factor in the latest price-sensitive company announcements or qualitative material. Simply Wall St has no position in any stocks mentioned.