Is It Too Late To Consider American Tower (AMT) After Its Recent Share Price Rebound?
American Tower Corporation AMT | 177.79 | +0.79% |
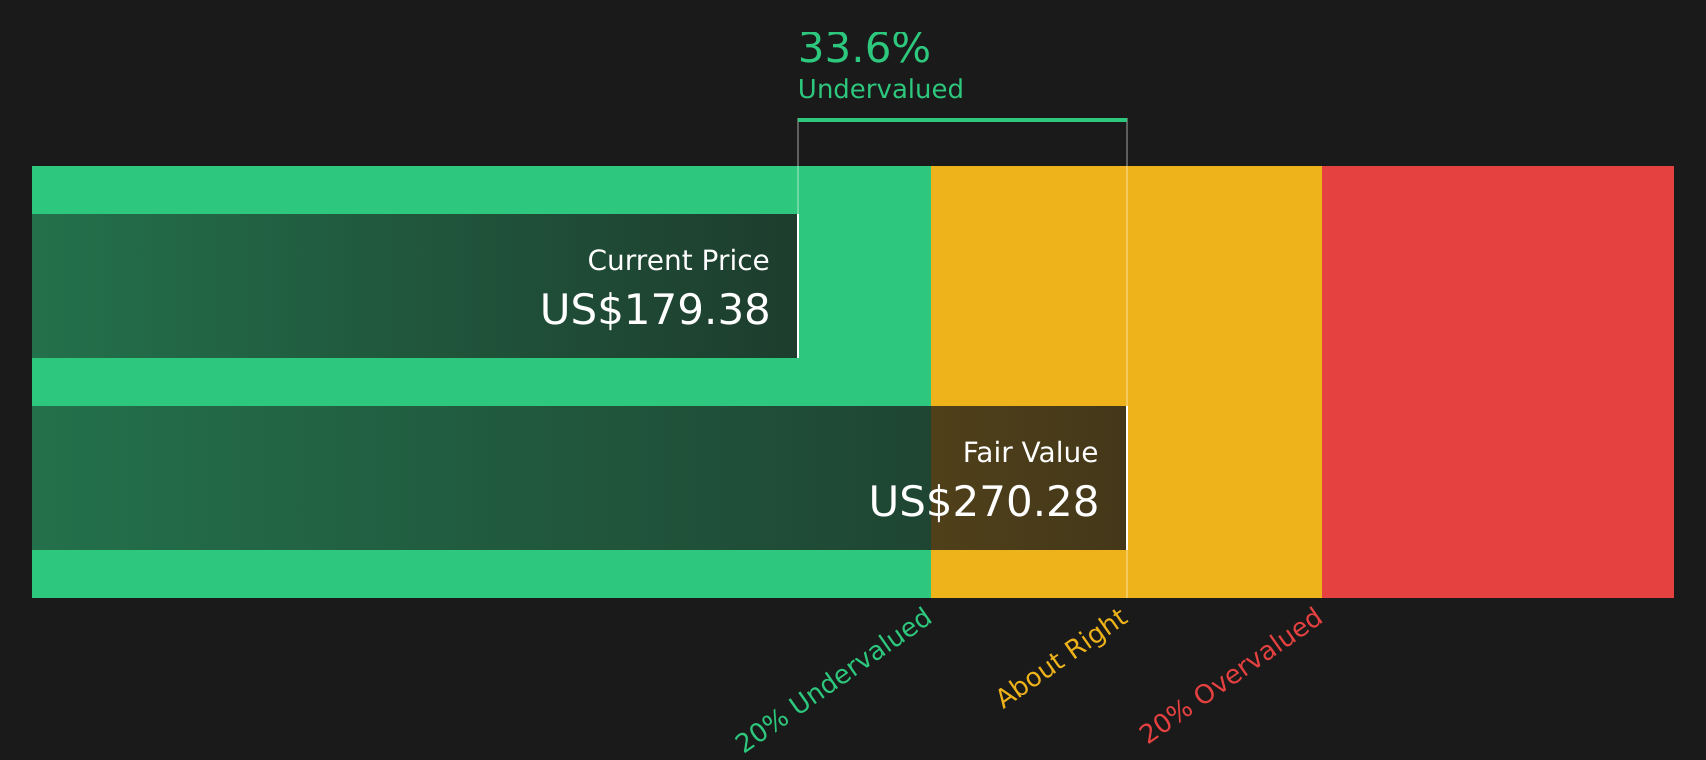
- Wondering if American Tower is still a solid home for your capital at around US$190.20, or if the current price is leaving too much on the table for new investors?
- The stock has been relatively quiet over the last week with a 0.1% return. However, the 6.1% return over 30 days and 8.8% year to date contrast with a 6.1% decline over the last year and a 10.9% return over five years.
- These moves sit against a backdrop where American Tower continues to draw interest as a key player in listed real estate. The stock remains in focus for investors who track sector heavyweights. While there has not been a single headline driving this specific rebound, the mix of recent attention and long term track record is keeping valuation firmly in the spotlight.
- On our checks, American Tower scores a 3 out of 6 valuation score. This means it screens as undervalued on half of the metrics we use. Next we will walk through those methods, then finish by looking at an even more rounded way to think about what the stock might be worth.
Approach 1: American Tower Discounted Cash Flow (DCF) Analysis
A Discounted Cash Flow model estimates what a business could be worth by projecting its future adjusted funds from operations, then discounting those cash flows back to today to reflect risk and the time value of money.
For American Tower, the model starts with last twelve month free cash flow of about $5.0b. Analysts provide explicit free cash flow estimates for the next few years, and Simply Wall St then extrapolates further to build a 10 year path. Those projections point to free cash flow of about $6.4b in 2030, with intermediate yearly estimates between those two anchors already discounted back to today.
Putting all those discounted cash flows together, the model arrives at an estimated intrinsic value of $256.11 per share. Compared with the recent share price of about $190.20, this assessment suggests the stock appears 25.7% undervalued using this DCF approach.
Result: UNDERVALUED
Our Discounted Cash Flow (DCF) analysis suggests American Tower is undervalued by 25.7%. Track this in your watchlist or portfolio, or discover 45 more high quality undervalued stocks.
Approach 2: American Tower Price vs Earnings
For a profitable company like American Tower, the P/E ratio is a useful way to gauge what investors are currently willing to pay for each dollar of earnings. A higher or lower P/E often reflects what the market thinks about a company’s growth prospects and risk profile, so there is no single “right” number. Faster expected growth and lower perceived risk can support a higher P/E, while slower growth or higher risk usually align with a lower one.
American Tower currently trades on a P/E of 35.0x. That sits above the Specialized REITs industry average of about 15.9x, but below the peer group average of 43.5x. To go beyond simple comparisons, Simply Wall St uses a proprietary “Fair Ratio” of 34.7x. This is the P/E level that might be expected after accounting for factors such as American Tower’s earnings growth profile, profit margins, size, risk characteristics and its industry.
Because the Fair Ratio is tailored to the company’s fundamentals, it can be more informative than broad peer or industry averages. With the current P/E of 35.0x sitting very close to the Fair Ratio of 34.7x, American Tower screens as trading at about the level implied by these inputs.
Result: ABOUT RIGHT

P/E ratios tell one story, but what if the real opportunity lies elsewhere? Start investing in legacies, not executives. Discover our 19 top founder-led companies.
Upgrade Your Decision Making: Choose your American Tower Narrative
Earlier we mentioned that there is an even better way to understand valuation, so let us introduce you to Narratives, which are simply your own story about a company, linked directly to your assumptions for fair value and for future revenue, earnings and margins.
Instead of only looking at a P/E or a single DCF output, a Narrative lets you say what you think is happening at American Tower, translate that view into a forecast, then into a fair value that you can compare with today’s share price to decide whether the stock looks attractive or stretched for you.
Narratives are available on Simply Wall St’s Community page, where millions of investors share different stories about the same company. Each Narrative updates automatically when fresh information such as earnings releases or news flows through, so your fair value view stays current without you rebuilding everything from scratch.
For example, one American Tower Narrative might see a relatively cautious outlook and arrive at a lower fair value. Another might assume stronger long term prospects and set a higher fair value, giving you a clear sense of how different perspectives line up against the current US$190.20 share price.
Do you think there's more to the story for American Tower? Head over to our Community to see what others are saying!

This article by Simply Wall St is general in nature. We provide commentary based on historical data and analyst forecasts only using an unbiased methodology and our articles are not intended to be financial advice. It does not constitute a recommendation to buy or sell any stock, and does not take account of your objectives, or your financial situation. We aim to bring you long-term focused analysis driven by fundamental data. Note that our analysis may not factor in the latest price-sensitive company announcements or qualitative material. Simply Wall St has no position in any stocks mentioned.