Is It Too Late To Consider Ameriprise Financial (AMP) After Its Strong Multi‑Year Run?
Ameriprise Financial, Inc. AMP | 0.00 |
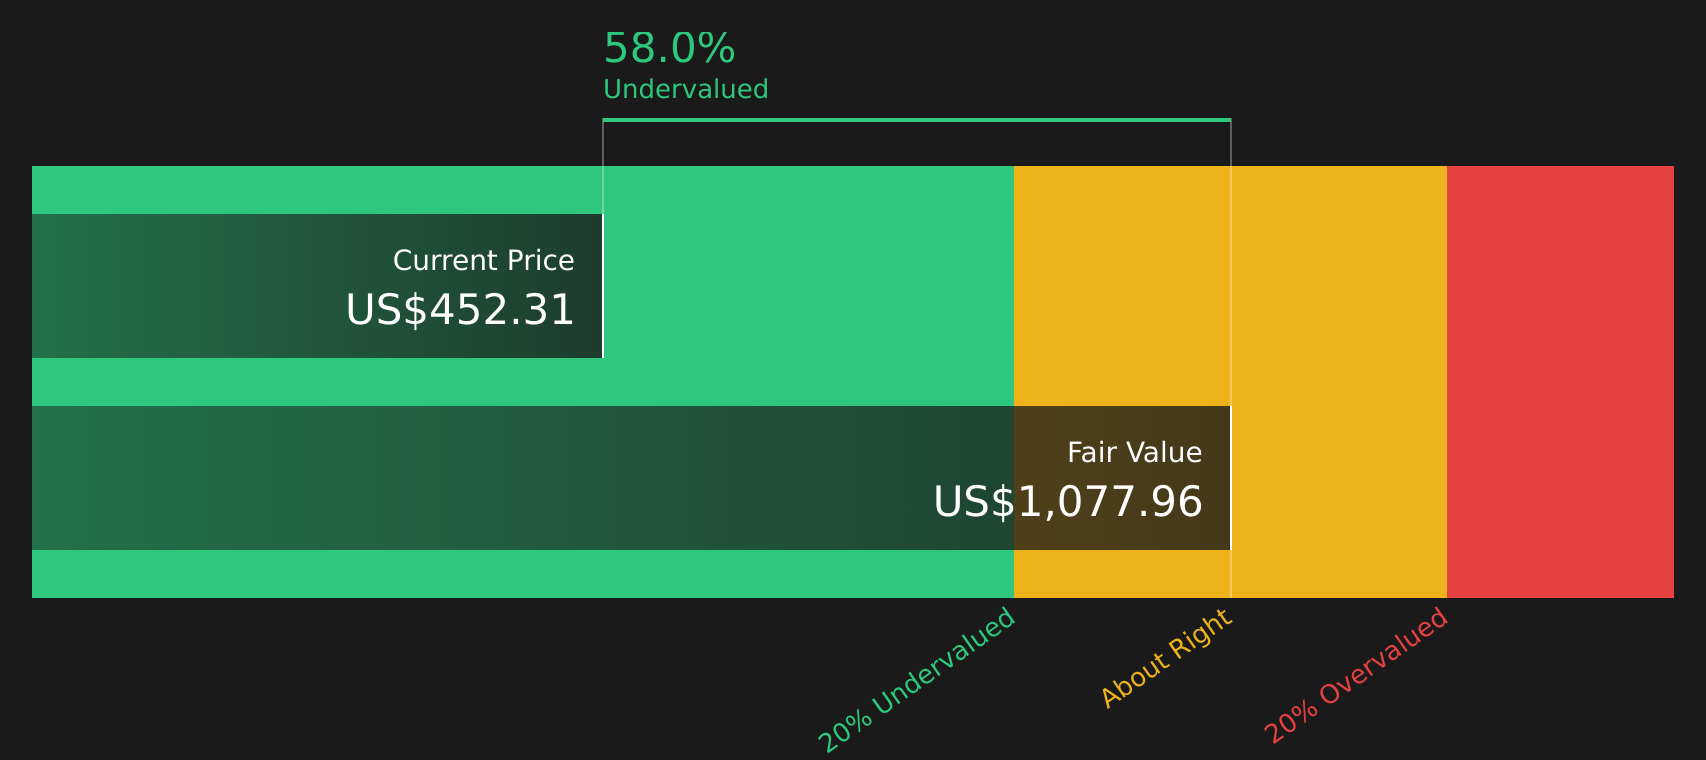
- Wondering if Ameriprise Financial is offering good value at its current price, or if the recent run means you might be late to the story?
- The stock last closed at US$461.08, with a 5.0% gain over 30 days, a small 0.2% decline over 7 days, and returns of 93.7% over 5 years and 65.8% over 3 years. These figures may catch your eye if you are weighing growth potential against risk.
- Recent coverage around Ameriprise Financial has focused on its role in the broader capital markets sector and how investor sentiment toward financials generally can affect pricing. This context helps frame the mix of short term share price swings and longer term returns you see in the numbers.
- Ameriprise Financial currently has a valuation score of 5/6. It is worth looking at how traditional valuation tools stack up for the stock, followed by an even more complete way to think about what that score really means.
Approach 1: Ameriprise Financial Excess Returns Analysis
The Excess Returns model looks at how much profit a company is expected to generate above the return that shareholders require, then converts those extra profits into a per share value today.
For Ameriprise Financial, the model starts with a Book Value of $71.76 per share and a Stable EPS of $47.37 per share, based on weighted future Return on Equity estimates from 5 analysts. The implied cost of equity is $8.89 per share, which leads to an Excess Return of $38.48 per share. In other words, the company is expected to earn meaningfully more than the return its equity investors are assumed to require.
The Average Return on Equity used in the model is 49.65%, and the Stable Book Value is $95.42 per share, based on weighted future Book Value estimates from 6 analysts. Combining these inputs, the Excess Returns valuation produces an estimated intrinsic value that implies the shares are 38.2% below this model value at the recent price of US$461.08.
Result: UNDERVALUED
Our Excess Returns analysis suggests Ameriprise Financial is undervalued by 38.2%. Track this in your watchlist or portfolio, or discover 58 more high quality undervalued stocks.
Approach 2: Ameriprise Financial Price vs Earnings
For profitable companies like Ameriprise Financial, the P/E ratio is a straightforward way to connect the share price with the earnings that support it. You are essentially asking how many dollars you are paying for each dollar of current earnings.
What counts as a “normal” or “fair” P/E depends on how the market views a company’s growth prospects and risks. Higher expected growth or lower perceived risk can support a higher P/E, while slower expected growth or higher risk usually lines up with a lower multiple.
Ameriprise Financial currently trades on a P/E of 11.74x. This sits well below the Capital Markets industry average P/E of 41.68x and also below the peer group average of 25.15x. Simply Wall St’s Fair Ratio for Ameriprise Financial is 14.01x, which is a proprietary estimate of what the P/E might be given factors such as the company’s earnings growth profile, profit margins, industry, market cap and risk characteristics. Compared with simple peer or industry comparisons, this Fair Ratio aims to tailor the multiple more closely to Ameriprise Financial’s own fundamentals. With the actual P/E of 11.74x below the Fair Ratio of 14.01x, the shares screen as undervalued on this metric.
Result: UNDERVALUED

P/E ratios tell one story, but what if the real opportunity lies elsewhere? Start investing in legacies, not executives. Discover our 19 top founder-led companies.
Upgrade Your Decision Making: Choose your Ameriprise Financial Narrative
Earlier it was mentioned that there is an even better way to understand valuation, so Narratives are introduced as a simple way for you to attach a clear story about Ameriprise Financial to the numbers you see. This links your view of its revenue, earnings and margins to a forecast and Fair Value on Simply Wall St’s Community page, then compares that Fair Value with today’s price. Each Narrative updates automatically as new news or earnings arrive. For example, one investor might build a bullish Ameriprise Financial Narrative that lines up with a Fair Value of US$615, while another might use a more cautious Fair Value closer to US$452, and both can quickly see how their own story lines up against the current market price.
Do you think there's more to the story for Ameriprise Financial? Head over to our Community to see what others are saying!

This article by Simply Wall St is general in nature. We provide commentary based on historical data and analyst forecasts only using an unbiased methodology and our articles are not intended to be financial advice. It does not constitute a recommendation to buy or sell any stock, and does not take account of your objectives, or your financial situation. We aim to bring you long-term focused analysis driven by fundamental data. Note that our analysis may not factor in the latest price-sensitive company announcements or qualitative material. Simply Wall St has no position in any stocks mentioned.