Is It Too Late To Consider Baker Hughes (BKR) After A 72% One Year Rally?
Baker Hughes BKR | 0.00 |
- If you are wondering whether Baker Hughes stock still offers value after its strong run, or if you might be turning up late to the story, this breakdown aims to help you frame that question clearly.
- The stock last closed at US$64.12, with returns of 7.3% over the past 30 days and 36.0% year to date, while the 1-year return stands at 72.1% and the 3-year and 5-year returns are 142.9% and 187.4% respectively.
- Recent trading has been in the spotlight as investors react to ongoing news around energy markets and large-scale oil and gas services demand. These themes often influence sentiment toward companies like Baker Hughes and can help explain why the stock has been on many investors' watchlists.
- Baker Hughes currently has a valuation score of 4/6. Next, you will see how that relates to different valuation approaches, followed by a framework that can help you think about value in a more complete way.
Approach 1: Baker Hughes Discounted Cash Flow (DCF) Analysis
A Discounted Cash Flow, or DCF, model estimates what a stock could be worth by projecting the company’s future cash flows and then discounting them back to today’s value.
For Baker Hughes, the model used is a 2 Stage Free Cash Flow to Equity approach based on cash flow projections. The company’s latest twelve month free cash flow is about $2.3b. Simply Wall St uses analyst estimates for the next few years and then extrapolates further out, with projected free cash flow of $3.7b in 2030 and a series of annual projections in between.
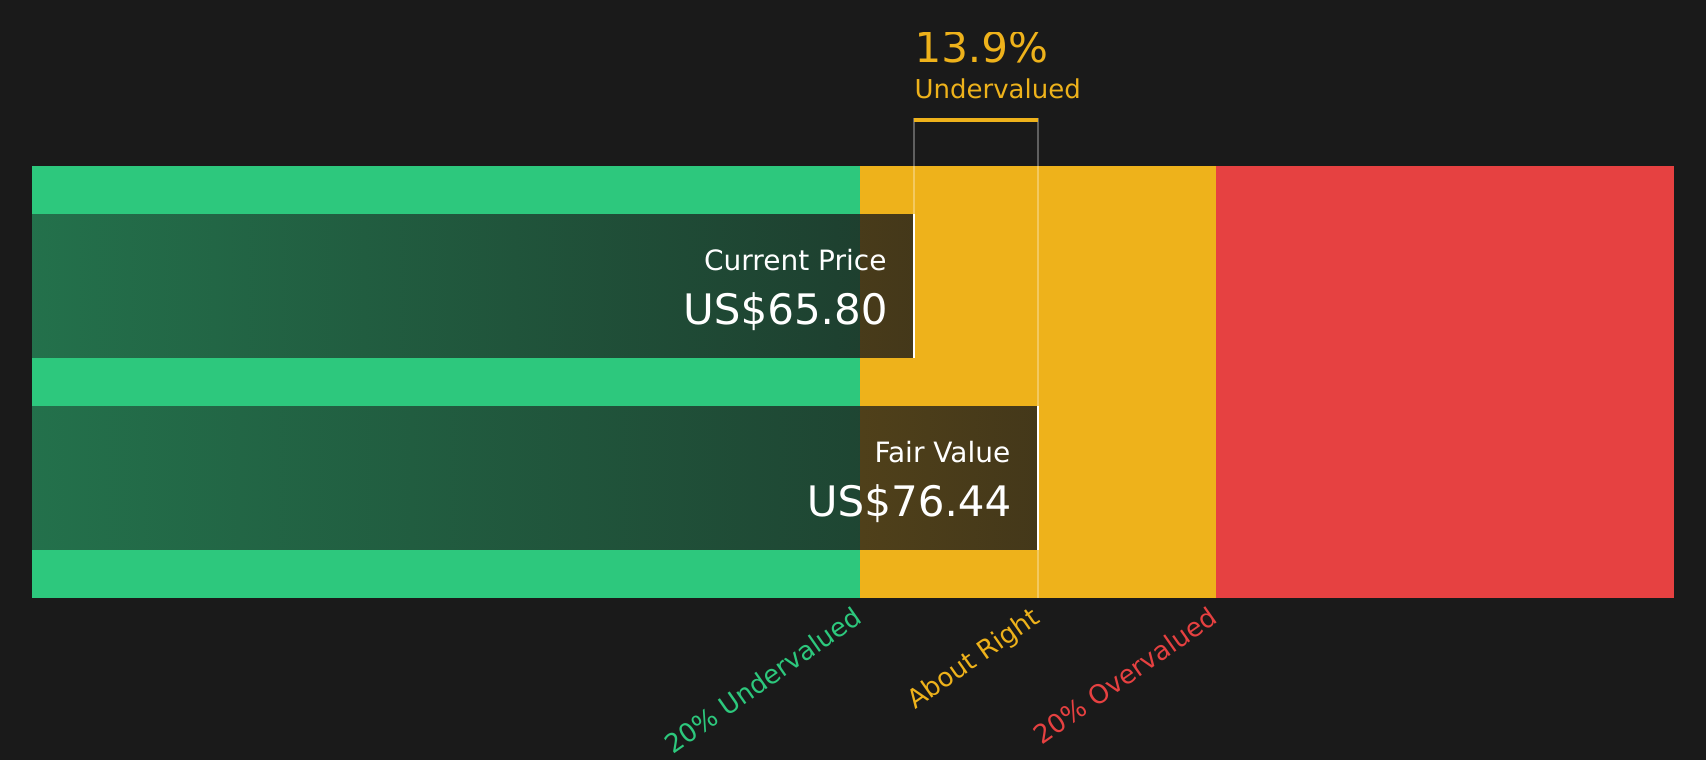
When those projected cash flows are discounted back to today, the DCF model suggests an intrinsic value of about $76.31 per share. Compared with the recent share price of $64.12, this implies the stock is around 16.0% undervalued under these assumptions.
Result: UNDERVALUED
Our Discounted Cash Flow (DCF) analysis suggests Baker Hughes is undervalued by 16.0%. Track this in your watchlist or portfolio, or discover 51 more high quality undervalued stocks.
Approach 2: Baker Hughes Price vs Earnings
For a profitable company like Baker Hughes, the P/E ratio is a common way to think about what you are paying for each dollar of earnings. It ties directly to what the business currently earns, which many investors find easier to relate to than long range cash flow forecasts.
In general, higher growth expectations and lower perceived risk tend to support a higher “normal” or “fair” P/E ratio, while slower expected growth or higher risk often go with a lower multiple. So context matters when you look at any single P/E number.
Baker Hughes currently trades on a P/E of 20.4x, compared with an Energy Services industry average of 26.6x and a peer group average of 22.7x. Simply Wall St also calculates a proprietary “Fair Ratio” for Baker Hughes of 23.5x, based on factors such as earnings growth, industry, profit margin, market cap and risk profile.
This Fair Ratio aims to be more tailored than a simple comparison with industry or peer averages because it incorporates company specific fundamentals and risk, rather than assuming Baker Hughes should match its sector or direct peers.
Comparing the current P/E of 20.4x with the Fair Ratio of 23.5x suggests the stock is trading below that Fair Ratio estimate.
Result: UNDERVALUED

P/E ratios tell one story, but what if the real opportunity lies elsewhere? Start investing in legacies, not executives. Discover our 19 top founder-led companies.
Upgrade Your Decision Making: Choose your Baker Hughes Narrative
Earlier it was mentioned that there is an even better way to understand valuation. Narratives on Simply Wall St let you attach a clear story about Baker Hughes to the numbers by linking your view of its future revenue, earnings and margins to a forecast and then to a Fair Value that you can compare with the current price. This is all within an easy Community page tool that updates when new information such as earnings or news arrives. One investor might lean toward a cautious Fair Value closer to US$48.00, while another focuses on a more optimistic Fair Value nearer US$80.00, and each can quickly see whether their own story suggests the stock looks cheap or expensive relative to where it trades today.
For Baker Hughes however we will make it really easy for you with previews of two leading Baker Hughes Narratives:
Fair Value: US$80.00
Implied discount vs Fair Value: about 19.9% below that Fair Value at the recent US$64.12 share price
Revenue growth assumption: 7.09% a year
- Leans on record IET orders, a US$33.1b backlog and growing Power Systems exposure to data centers and electricity demand to support multi year revenue visibility.
- Assumes earnings reach US$3.6b by around 2029 with profit margins near 10.5%, supported by LNG, gas infrastructure, carbon management and higher margin digital solutions.
- Values the stock at a Fair Value of US$80.00 using a 27.4x P/E on those 2029 earnings and a 7.4% discount rate, which sits above the consensus target and reflects the bullish analyst cohort.
Fair Value: US$52.30
Implied premium vs Fair Value: about 22.6% above that Fair Value at the recent US$64.12 share price
Revenue growth assumption: 1.50% a year
- Focuses on concentration in LNG, gas infrastructure and data center power projects, where slower approvals or demand could weigh on IET orders, backlog conversion and margins.
- Builds in revenue growth of 1.5% a year and margin compression to 8.8%, with earnings of US$2.6b by around 2029 that sit below today’s level.
- Arrives at a Fair Value of about US$52.30 using a 25.6x P/E on those earnings and a 7.7% discount rate, which is well below consensus targets and reflects the more cautious analyst cohort.
If you want to see how other investors are weighing these bullish and bearish paths for Baker Hughes, you can review the full narratives and their underlying assumptions side by side, then decide which story lines up better with your own view of the stock.
Do you think there's more to the story for Baker Hughes? Head over to our Community to see what others are saying!

This article by Simply Wall St is general in nature. We provide commentary based on historical data and analyst forecasts only using an unbiased methodology and our articles are not intended to be financial advice. It does not constitute a recommendation to buy or sell any stock, and does not take account of your objectives, or your financial situation. We aim to bring you long-term focused analysis driven by fundamental data. Note that our analysis may not factor in the latest price-sensitive company announcements or qualitative material. Simply Wall St has no position in any stocks mentioned.