Is It Too Late To Consider Baker Hughes (BKR) After A 75% One-Year Surge?
Baker Hughes BKR | 0.00 |
- Wondering if Baker Hughes at around US$64.27 is still offering value after a strong run, or if you might be late to the party.
- The stock is up 1.7% over the last 7 days and 36.3% year to date, although it is down 6.9% over the last month after a 75.3% return over the past year, 123.9% over 3 years, and 180.7% over 5 years.
- Recent coverage has focused on Baker Hughes as a key energy services stock, with investors watching how contract wins, energy infrastructure spending and sector sentiment relate to the share price. This context helps explain why the stock can move sharply as markets reassess growth potential and risk.
- On Simply Wall St's valuation checks, Baker Hughes scores a 4 out of 6 valuation score. This sets up a closer look at how traditional metrics like P/E and DCF stack up for the stock, and hints at an even more complete way of thinking about value that will be covered at the end of this article.
Approach 1: Baker Hughes Discounted Cash Flow (DCF) Analysis
A Discounted Cash Flow model estimates what a stock could be worth by projecting future cash flows and then discounting them back to today’s value. For Baker Hughes, the model used is a 2 Stage Free Cash Flow to Equity approach based on cash flow projections.
The company’s latest twelve month Free Cash Flow is about $2.3b. Simply Wall St uses analyst estimates for the next few years, then extends those trends, resulting in projected Free Cash Flow of $3.7b by 2030. Each of these future cash flows is discounted back to today using a required return. This produces a total estimated equity value per share.
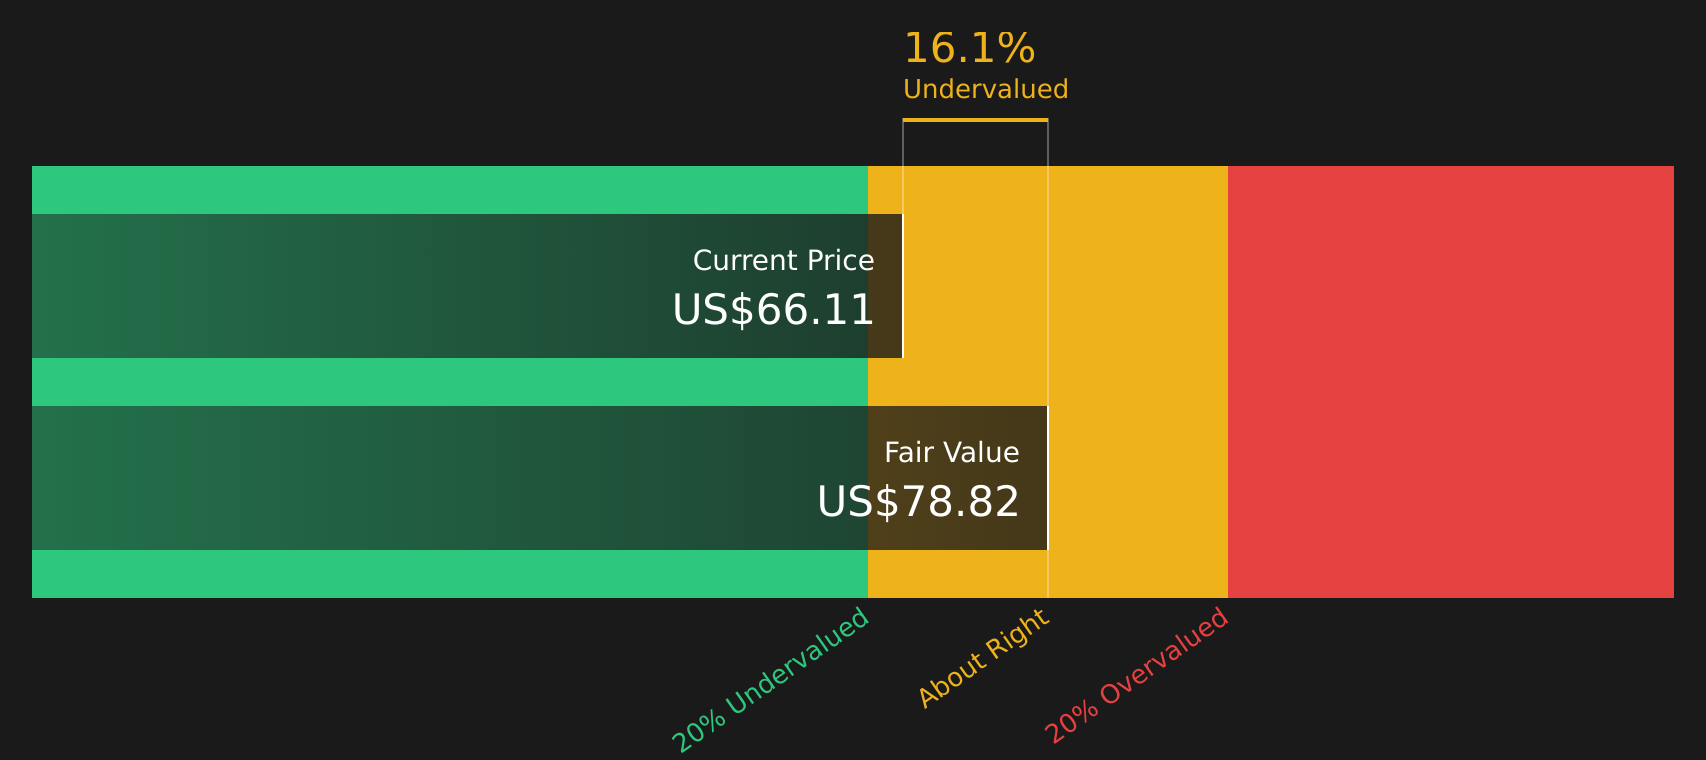
On this basis, the DCF model points to an intrinsic value of about $76.65 per share. Compared with the recent share price of around $64.27, the model suggests Baker Hughes trades at roughly a 16.2% discount. This indicates the stock is currently assessed as undervalued using this cash flow approach.
Result: UNDERVALUED
Our Discounted Cash Flow (DCF) analysis suggests Baker Hughes is undervalued by 16.2%. Track this in your watchlist or portfolio, or discover 47 more high quality undervalued stocks.
Approach 2: Baker Hughes Price vs Earnings
For profitable companies, the P/E ratio is a straightforward way to link what you pay for the stock to the earnings it generates. It helps you see how many dollars investors are currently willing to pay for each dollar of profit.
What counts as a “normal” P/E depends on how the market sees a company’s growth potential and risk. Faster expected earnings growth or lower perceived risk can justify a higher P/E, while lower growth or higher risk often goes with a lower P/E.
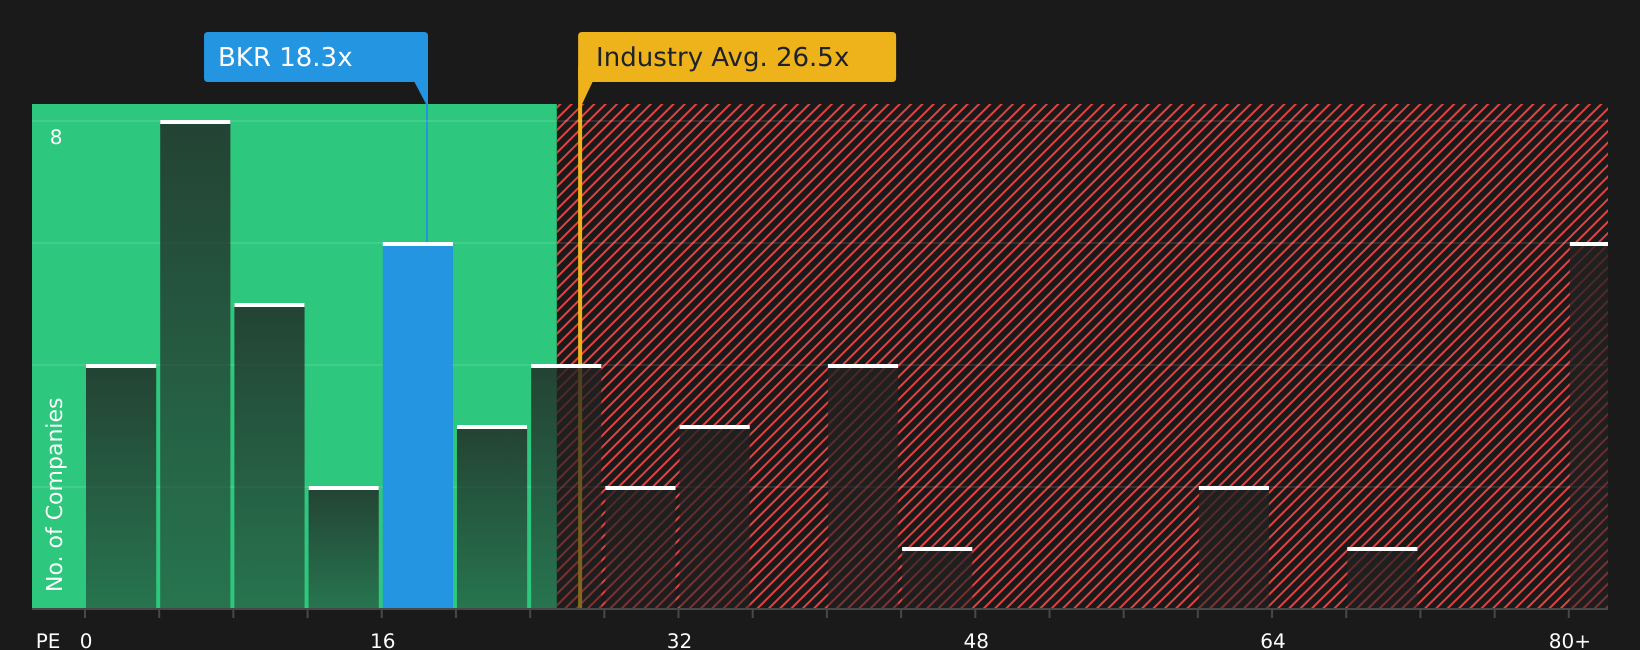
Baker Hughes currently trades on a P/E of about 20.46x, compared with the Energy Services industry average of roughly 26.77x and a peer group average of about 38.73x. Simply Wall St also calculates a proprietary “Fair Ratio” for the stock of around 20.50x. This Fair Ratio is designed to reflect what P/E might make sense for Baker Hughes specifically, given factors such as its earnings growth profile, industry, profit margin, market capitalization and key risks.
This makes the Fair Ratio more tailored than a simple comparison with broad industry or peer averages, which may include companies with very different characteristics. With Baker Hughes trading at 20.46x versus a Fair Ratio of 20.50x, the multiple looks very close to what the model suggests.
Result: ABOUT RIGHT
Wall Street's queuing for one rocket. While SpaceX counts down to its IPO, other companies tied to the new space race are already in orbit. → 20 Compelling Space Companies watchlist · Global Space Race Investing Ideas screener · Scan the sector by valuation on Rocket Lab's valuation page.
Upgrade Your Decision Making: Choose your Baker Hughes Narrative
Earlier it was mentioned that there is an even better way to think about valuation. Narratives on Simply Wall St’s Community page let you connect your own story about Baker Hughes to specific forecasts for revenue, earnings and margins, then to a Fair Value that you can compare with the current price. One investor is leaning toward a more cautious view closer to US$52.30, while another is leaning toward a more optimistic view around US$80.00. These Narratives are refreshed when new information such as earnings or major project updates arrive, so you can quickly see how different perspectives translate into updated fair values and use that to decide how the stock fits your portfolio.
For Baker Hughes however, we will make it really easy for you with previews of two leading Baker Hughes Narratives:
Each one ties together the same core data in a different way, so you can quickly see which story is closer to how you see the stock and then decide what that implies for your own fair value range.
Fair value in this bullish narrative: US$80.00 per share.
Implied discount to that fair value at the recent US$64.27 share price: about 19.8% below the narrative fair value.
Revenue growth assumption in this narrative: 7.09% a year.
- Focuses on record IET orders, a US$33.1b backlog and growing exposure to LNG, gas infrastructure, carbon management and power systems, which together support multi year visibility for equipment and services revenue.
- Highlights growing digital and software exposure, including Cordant and Leucipa, as a way to increase higher margin recurring revenue tied to monitoring and optimization across the installed base.
- Assumes that portfolio reshaping, the planned Chart acquisition and targeted cost synergies of US$325m help support EBITDA margins and free cash flow, with bullish analyst fair value expectations clustering around US$80.00.
Fair value in this bearish narrative: US$52.30 per share.
Implied premium to that fair value at the recent US$64.27 share price: about 22.9% above the narrative fair value.
Revenue growth assumption in this narrative: 1.50% a year.
- Emphasizes how a heavy tilt toward LNG, gas infrastructure and data center related power projects could leave revenue vulnerable if approvals slow, demand eases or maintenance and export flows are pushed out.
- Flags execution risk around the planned Chart acquisition and multiple divestitures at a time when the narrative assumes Baker Hughes is relying on US$325m of cost synergies and US$3b of proceeds to support EBITDA margins and the balance sheet.
- Frames a lower fair value of about US$52.30 using weaker revenue growth, lower profit margins and a 25.6x P/E on 2029 earnings, with the current price sitting well above that bearish range.
The gap between these two narratives shows how different assumptions about LNG and power demand, margins, project execution and digital growth can move fair value from the low US$50s to around US$80. The key step now is to decide which set of assumptions feels closer to your own view of Baker Hughes and where that places the stock in your portfolio.
To see how these results tie into long-term growth, risks, and valuation, check out the full range of community narratives for Baker Hughes on Simply Wall St. Add the company to your watchlist or portfolio so you'll be alerted when the story evolves.
Do you think there's more to the story for Baker Hughes? Head over to our Community to see what others are saying!

This article by Simply Wall St is general in nature. We provide commentary based on historical data and analyst forecasts only using an unbiased methodology and our articles are not intended to be financial advice. It does not constitute a recommendation to buy or sell any stock, and does not take account of your objectives, or your financial situation. We aim to bring you long-term focused analysis driven by fundamental data. Note that our analysis may not factor in the latest price-sensitive company announcements or qualitative material. Simply Wall St has no position in any stocks mentioned.