Is It Too Late To Consider Camtek (CAMT) After 154% One Year Surge In Price?
Camtek Ltd CAMT | 157.73 | -0.61% |
- Wondering if Camtek at around US$159.86 is still offering value after such a strong run, or if you might be looking at a stock that has already priced in much of the good news.
- The share price shows a mixed picture in the short term, with a 7.2% decline over the last week and a 2.4% decline over the past month, while still sitting on a 38.4% year to date gain and a 153.9% return over the past year.
- Those moves come alongside a very large 3 year return of roughly 5x and a 393.3% return over 5 years, which puts Camtek on the radar of investors who focus on longer term performance as well as recent volatility. That combination often prompts closer scrutiny of whether the current price still lines up with underlying fundamentals.
- On Simply Wall St’s valuation checks, Camtek currently scores 0 out of 6, as shown in its valuation score. The next step is to look at how different valuation methods assess the stock today and why a broader way of thinking about value could matter even more by the end of this review.
Camtek scores just 0/6 on our valuation checks. See what other red flags we found in the full valuation breakdown.
Approach 1: Camtek Discounted Cash Flow (DCF) Analysis
A Discounted Cash Flow, or DCF, model takes estimates of the cash a company could generate in the future and discounts those back to today, aiming to arrive at an intrinsic value per share.
For Camtek, the model used is a 2 Stage Free Cash Flow to Equity approach. The latest trailing twelve month Free Cash Flow is about $128.5 million. Analyst estimates and internal projections point to Free Cash Flow of $143.2 million in 2026 and $170.1 million in 2027, with further projected figures such as $212.7 million in 2029 and $309.5 million in 2035. Beyond the first five years, Simply Wall St extrapolates the cash flows rather than relying on additional analyst coverage.
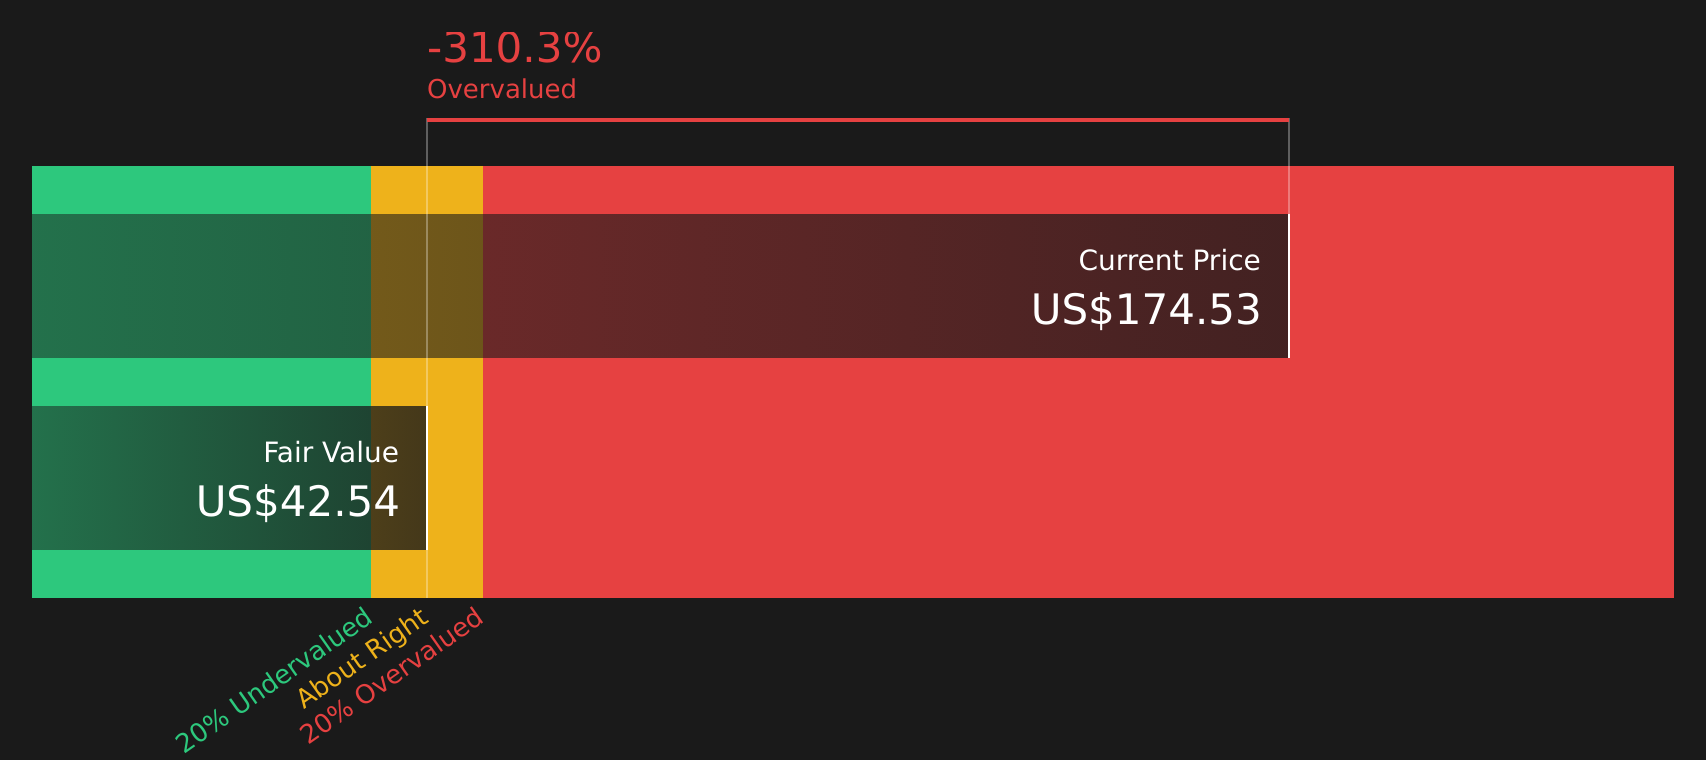
After discounting all these projected cash flows back to today, the model arrives at an estimated intrinsic value of about $42.30 per share. Versus a share price around $159.86, this implies Camtek is very fully priced, with the DCF indicating it is 277.9% overvalued on this metric.
Result: OVERVALUED
Our Discounted Cash Flow (DCF) analysis suggests Camtek may be overvalued by 277.9%. Discover 61 high quality undervalued stocks or create your own screener to find better value opportunities.
Approach 2: Camtek Price vs Earnings
For profitable companies, the P/E ratio is a straightforward way to connect the price you pay with the earnings the business is currently generating. It helps you see how many dollars investors are willing to pay today for each dollar of earnings.
What counts as a “normal” P/E depends a lot on what the market expects for future growth and how risky those earnings appear. Higher expected growth and lower perceived risk usually support a higher P/E, while slower growth or higher risk typically align with a lower P/E.
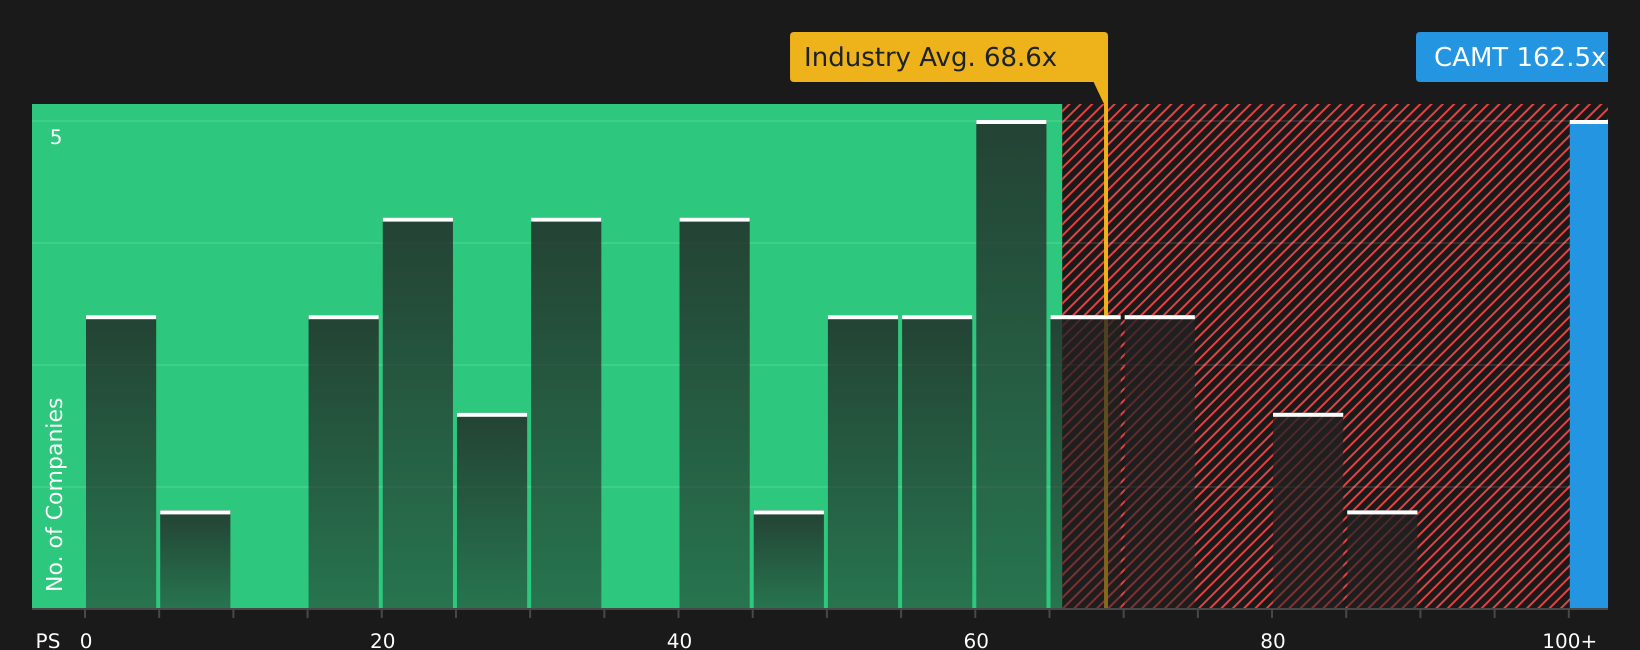
Camtek currently trades on a P/E of 146.71x. That is well above the Semiconductor industry average P/E of about 38.57x and also above the peer average of 75.93x. Simply Wall St’s Fair Ratio for Camtek is 52.51x, which is a proprietary estimate of what a reasonable P/E might be, given factors such as earnings growth, industry, profit margins, market cap and risk profile.
This Fair Ratio can be more useful than a simple comparison with peers or the broad industry because it adjusts for the specific mix of Camtek’s growth, risks and financial characteristics. Compared with the current 146.71x P/E, the 52.51x Fair Ratio points to Camtek trading well above this tailored benchmark.
Result: OVERVALUED
P/E ratios tell one story, but what if the real opportunity lies elsewhere? Start investing in legacies, not executives. Discover our 20 top founder-led companies.
Upgrade Your Decision Making: Choose your Camtek Narrative
Earlier it was mentioned that there is an even better way to understand valuation. Meet Narratives, where you attach a clear story about Camtek to the actual numbers you think are reasonable for its future revenue, earnings, margins and fair value, then see how that stacks up against the current share price.
On Simply Wall St’s Community page, Narratives give you a simple tool used by millions of investors that links Camtek’s business story to a financial forecast and a fair value, then keeps that view updated automatically when new earnings, guidance or news is added, so your reasoning does not go stale.
Narratives can also help you compare your view of Fair Value with the live market Price. For example, one Camtek Narrative might lean toward the bullish analyst fair value of about US$175, while another leans toward a more cautious view around US$110. Seeing that spread in one place helps you choose which version of the story you believe is closer to your own expectations.
For Camtek however, we will make it really easy for you with previews of two leading Camtek Narratives:
Start by asking which version of the story lines up better with how you see AI packaging demand, customer concentration in Asia, and what feels like a reasonable multiple for future earnings. Then use that as your base case when you compare it with the current share price around US$159.86.
Fair value: US$174.67
Upside from this fair value to the recent price of US$159.86 is about 8.5% below that narrative fair value.
Revenue growth used in this narrative: 16.62% per year
- Analysts in this camp see Camtek benefiting from advanced packaging, metrology workflows, and AI supported inspection tools that widen its technology edge and support higher margins over time.
- They build in assumptions for revenue growth of 16.6% a year and profit margins rising toward 40.0%, with earnings modeled at US$314.9m by around March 2029.
- On their numbers, the current share price sits close to a consensus fair value of about US$174.67, so the focus is on whether those growth, margin, and P/E assumptions feel realistic to you.
Fair value: US$110.00
Downside from this fair value to the recent price of US$159.86 is about 45.3% above that narrative fair value.
Revenue growth used in this narrative: 14.84% per year
- This narrative leans on the lower end of analyst targets, highlighting Camtek's reliance on high performance computing related demand, Chinese customers, and the risk that order visibility into 2026 equipment spending may be weaker than hoped.
- The bearish cohort works with revenue growth of about 14.8% a year and profit margins around 34.0%, with earnings modeled at US$163.9m by about May 2028 and a future P/E of roughly 30x.
- Here, the recent share price sits well above the implied fair value of US$110.00, so you would need to believe that growth, margins, or the multiple could come in below current expectations for this view to resonate.
Do you think there's more to the story for Camtek? Head over to our Community to see what others are saying!

This article by Simply Wall St is general in nature. We provide commentary based on historical data and analyst forecasts only using an unbiased methodology and our articles are not intended to be financial advice. It does not constitute a recommendation to buy or sell any stock, and does not take account of your objectives, or your financial situation. We aim to bring you long-term focused analysis driven by fundamental data. Note that our analysis may not factor in the latest price-sensitive company announcements or qualitative material. Simply Wall St has no position in any stocks mentioned.