Is It Too Late To Consider Cencora (COR) After Its Strong Three Year Share Price Run?
Cencora, Inc. COR | 321.42 | +1.21% |
- If you are wondering whether Cencora’s current share price still offers value or if most of the opportunity is already reflected, you are asking the right question for this stock.
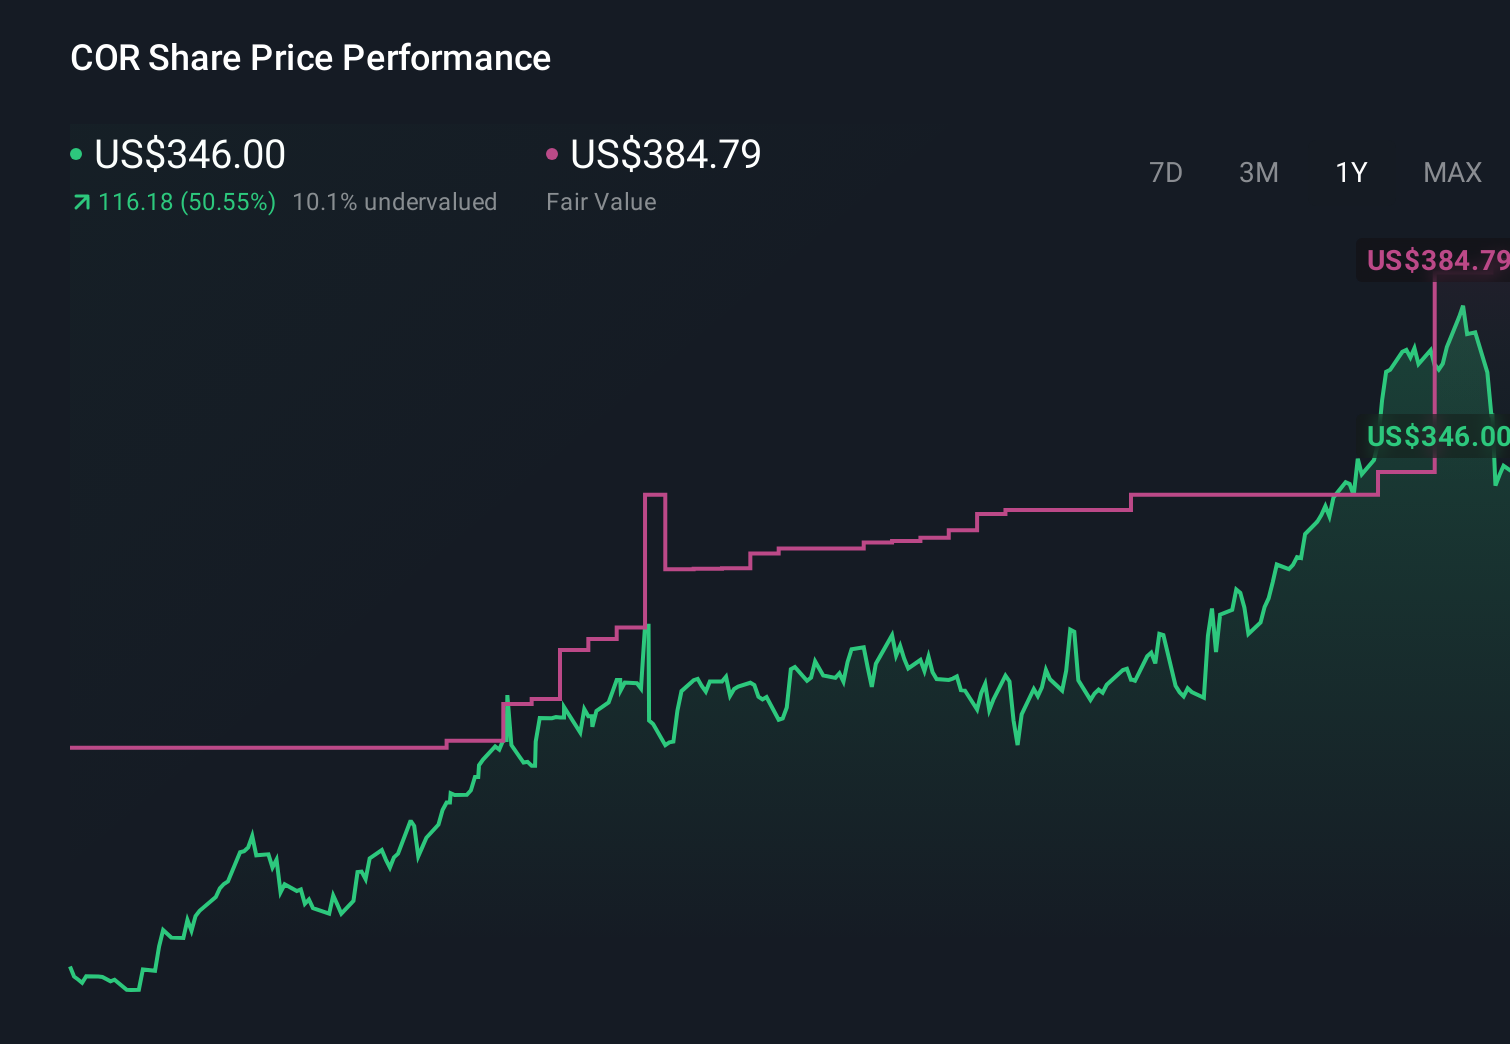
- With Cencora last closing at US$359.25 and returns of 0.0% over 7 days, 5.5% over 30 days, 6.0% year to date, 46.0% over 1 year and 131.5% over 3 years, the stock has clearly been on many investors’ radar.
- Recent attention on Cencora has been shaped by ongoing interest in large healthcare distributors and how they fit into the broader supply chain, along with continued focus on scale players in the sector. This backdrop helps explain why investors have been closely watching its share price performance over the past few years.
- Cencora currently has a valuation score of 2 out of 6. This means it screens as undervalued on only a minority of our checks. Next, we will walk through the different valuation approaches behind that score before finishing with an even more helpful lens for thinking about what the market might be pricing in.
Cencora scores just 2/6 on our valuation checks. See what other red flags we found in the full valuation breakdown.
Approach 1: Cencora Discounted Cash Flow (DCF) Analysis
A Discounted Cash Flow, or DCF, model estimates what a business could be worth by projecting its future cash flows and then discounting those projections back to today’s dollars.
For Cencora, the model used is a 2 Stage Free Cash Flow to Equity approach. The latest twelve month free cash flow is reported at about $3.7b. Analysts provide explicit projections for the next few years, and from 2031 onward Simply Wall St extrapolates additional estimates, with projected free cash flow reaching about $5.5b in 2030 and continuing to be modeled out to 2035.
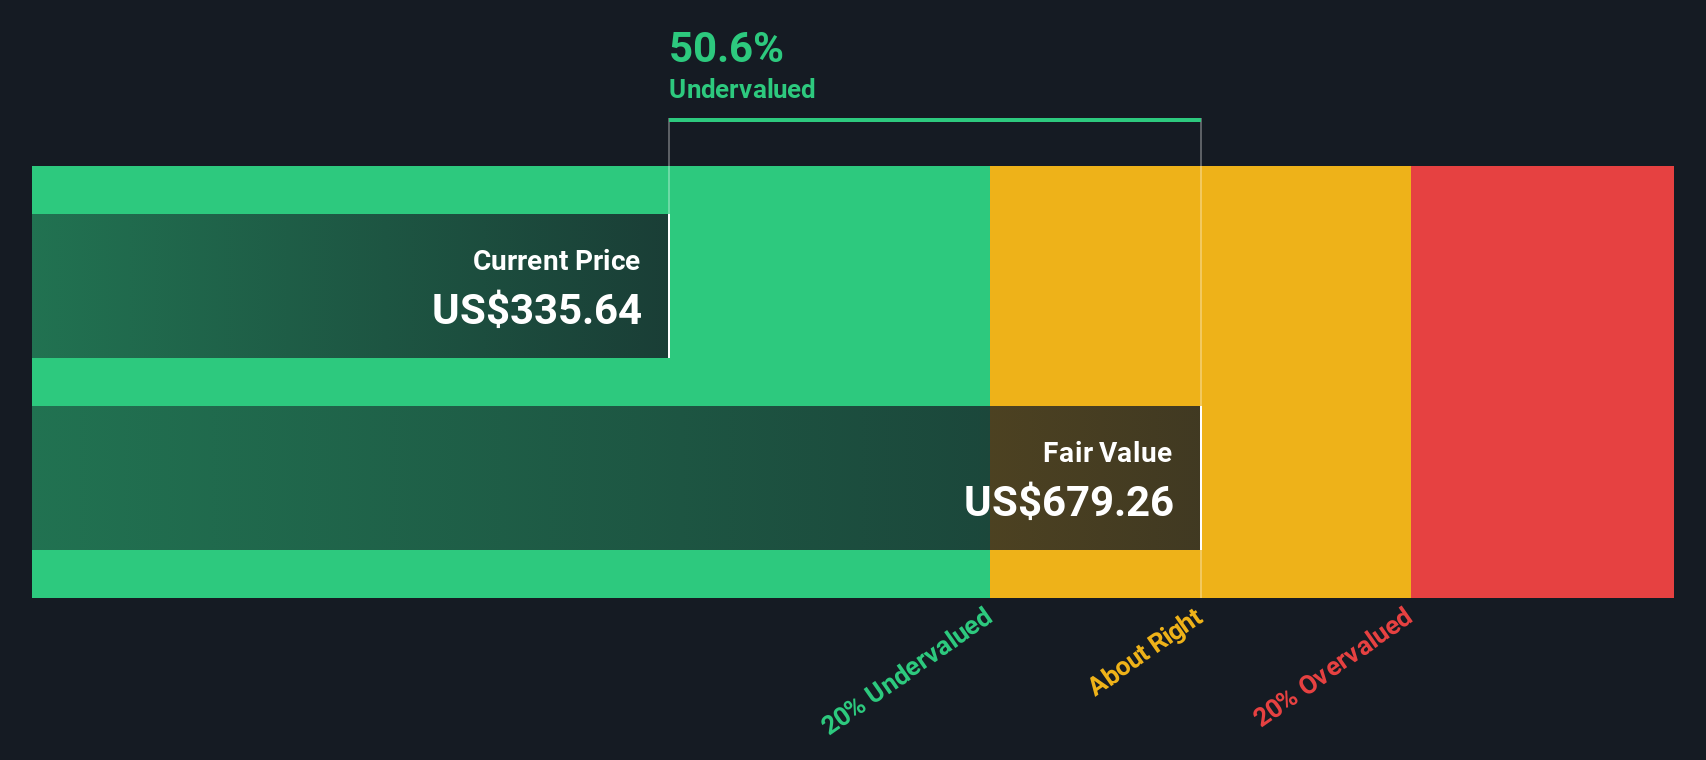
When all of these projected cash flows are discounted back, the DCF model arrives at an estimated intrinsic value of about $713.70 per share. Compared with the recent share price of US$359.25, this implies the stock screens as about 49.7% undervalued on this methodology.
Result: UNDERVALUED
Our Discounted Cash Flow (DCF) analysis suggests Cencora is undervalued by 49.7%. Track this in your watchlist or portfolio, or discover 53 more high quality undervalued stocks.
Approach 2: Cencora Price vs Earnings
For profitable companies like Cencora, the P/E ratio is a commonly used way to think about value because it links what you pay directly to current earnings. A higher or lower P/E often reflects what the market is willing to pay for each dollar of profit, given expectations and perceived risk.
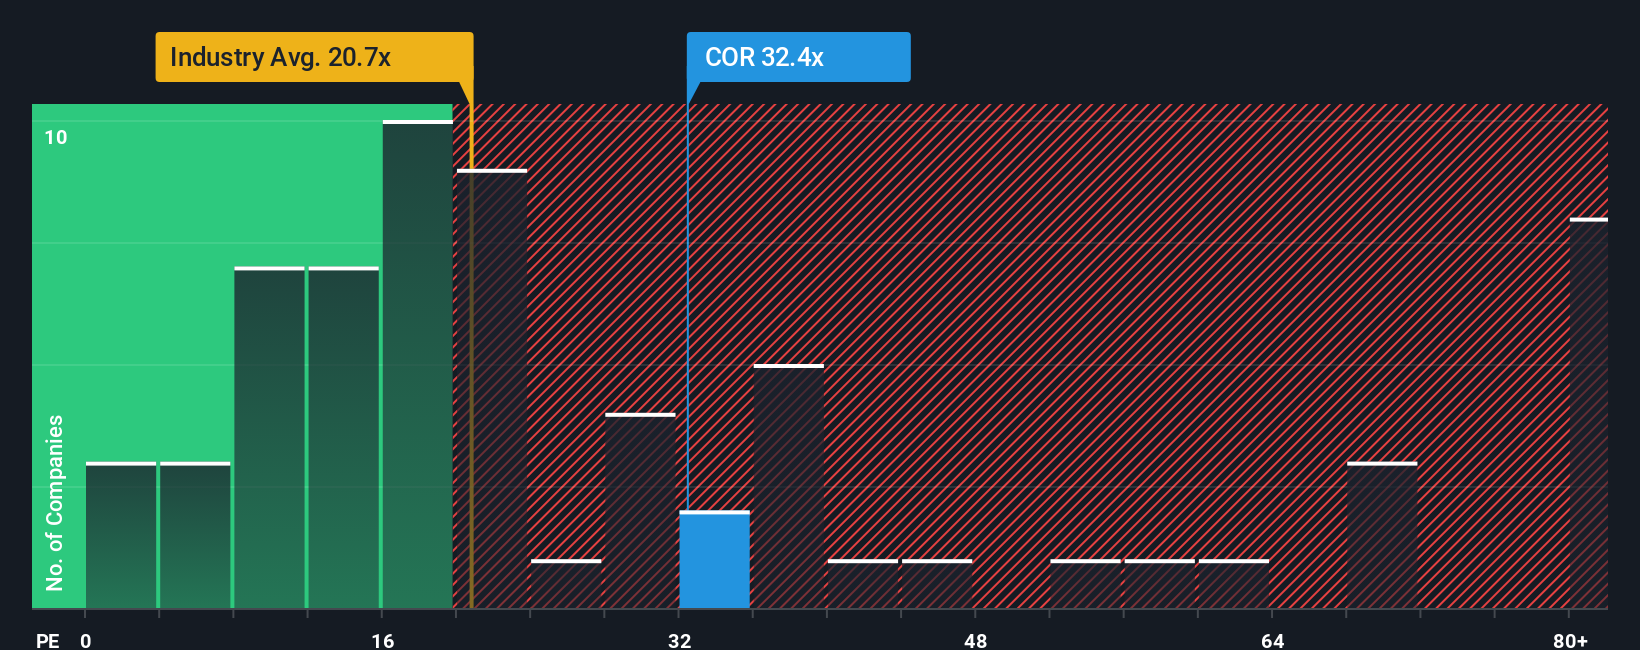
In simple terms, faster earnings growth and lower risk usually justify a higher, or more generous, P/E ratio, while slower growth and higher risk usually point to a lower, or more conservative, P/E. Cencora currently trades on a P/E of about 43.0x, compared with the Healthcare industry average of about 23.6x and a peer average of about 24.0x, so the stock is priced at a premium to these broad benchmarks.
Simply Wall St’s Fair Ratio for Cencora is 35.24x. This is a proprietary estimate of what a reasonable P/E might be, given factors such as the company’s earnings growth profile, profit margins, industry, market cap and risk characteristics. Because it incorporates these fundamentals, the Fair Ratio can often be more informative than a simple comparison with industry or peer averages. Against this Fair Ratio, Cencora’s current 43.0x P/E suggests the shares screen as somewhat expensive on this metric.
Result: OVERVALUED
P/E ratios tell one story, but what if the real opportunity lies elsewhere? Start investing in legacies, not executives. Discover our 22 top founder-led companies.
Upgrade Your Decision Making: Choose your Cencora Narrative
Earlier we mentioned that there is an even better way to think about valuation, so let us introduce you to Narratives.
A Narrative is simply your story about Cencora, written in numbers, where you set your own fair value by plugging in what you believe about its future revenue, earnings and margins.
On Simply Wall St, used by millions of investors, Narratives sit inside the Community page and link three things in a clear chain: Cencora’s story, a financial forecast, and the resulting fair value estimate.
This makes it easier for you to decide what action makes sense because you can compare your Narrative Fair Value to today’s share price and see whether Cencora looks expensive, about right, or cheap to you.
Narratives also stay live. When new information like earnings releases or news is added to the platform, the projections and fair value tied to that story are refreshed so you are not working off stale assumptions.
For example, one Cencora Narrative on the Community page might set a relatively high fair value based on optimistic margin assumptions, while another might set a much lower fair value based on more conservative revenue growth and risk settings.
Do you think there's more to the story for Cencora? Head over to our Community to see what others are saying!
This article by Simply Wall St is general in nature. We provide commentary based on historical data and analyst forecasts only using an unbiased methodology and our articles are not intended to be financial advice. It does not constitute a recommendation to buy or sell any stock, and does not take account of your objectives, or your financial situation. We aim to bring you long-term focused analysis driven by fundamental data. Note that our analysis may not factor in the latest price-sensitive company announcements or qualitative material. Simply Wall St has no position in any stocks mentioned.