Is It Too Late To Consider Chubb (CB) After Its Strong Multi Year Share Price Run?
Chubb Limited CB | 0.00 |
- Investors may be wondering whether Chubb, at around US$328 per share, still offers value or if most of the opportunity is already reflected in the current price.
- The stock has seen a 1.4% decline over the last 7 days and a 0.7% decline over the past month, while still recording 5.9% year to date, 16.5% over 1 year, 67.9% over 3 years and 112.2% over 5 years.
- Recent coverage has focused on Chubb as a major player in the global insurance space. Investors are paying close attention to how its underwriting discipline and capital position feed into long term expectations. Broader market commentary around insurance stocks has also kept valuation front of mind, as investors weigh perceived resilience against the price paid for quality.
- Chubb currently has a valuation score of 2 out of 6. The sections that follow will walk through what different valuation methods suggest about the stock, before finishing with a framework that can help you assess value in a more complete way.
Chubb scores just 2/6 on our valuation checks. See what other red flags we found in the full valuation breakdown.
Approach 1: Chubb Excess Returns Analysis
The Excess Returns model looks at how much profit a company is expected to earn above the return that equity investors require, then capitalises those excess profits into a per share value.
For Chubb, the model starts with a Book Value of $188.59 per share and an Average Return on Equity of 13.12%. That translates into a Stable EPS estimate of $29.99 per share, based on weighted future Return on Equity estimates from 11 analysts. The required return, or Cost of Equity, is $15.53 per share, which leaves an Excess Return of $14.46 per share that the model treats as value created over and above the equity cost.
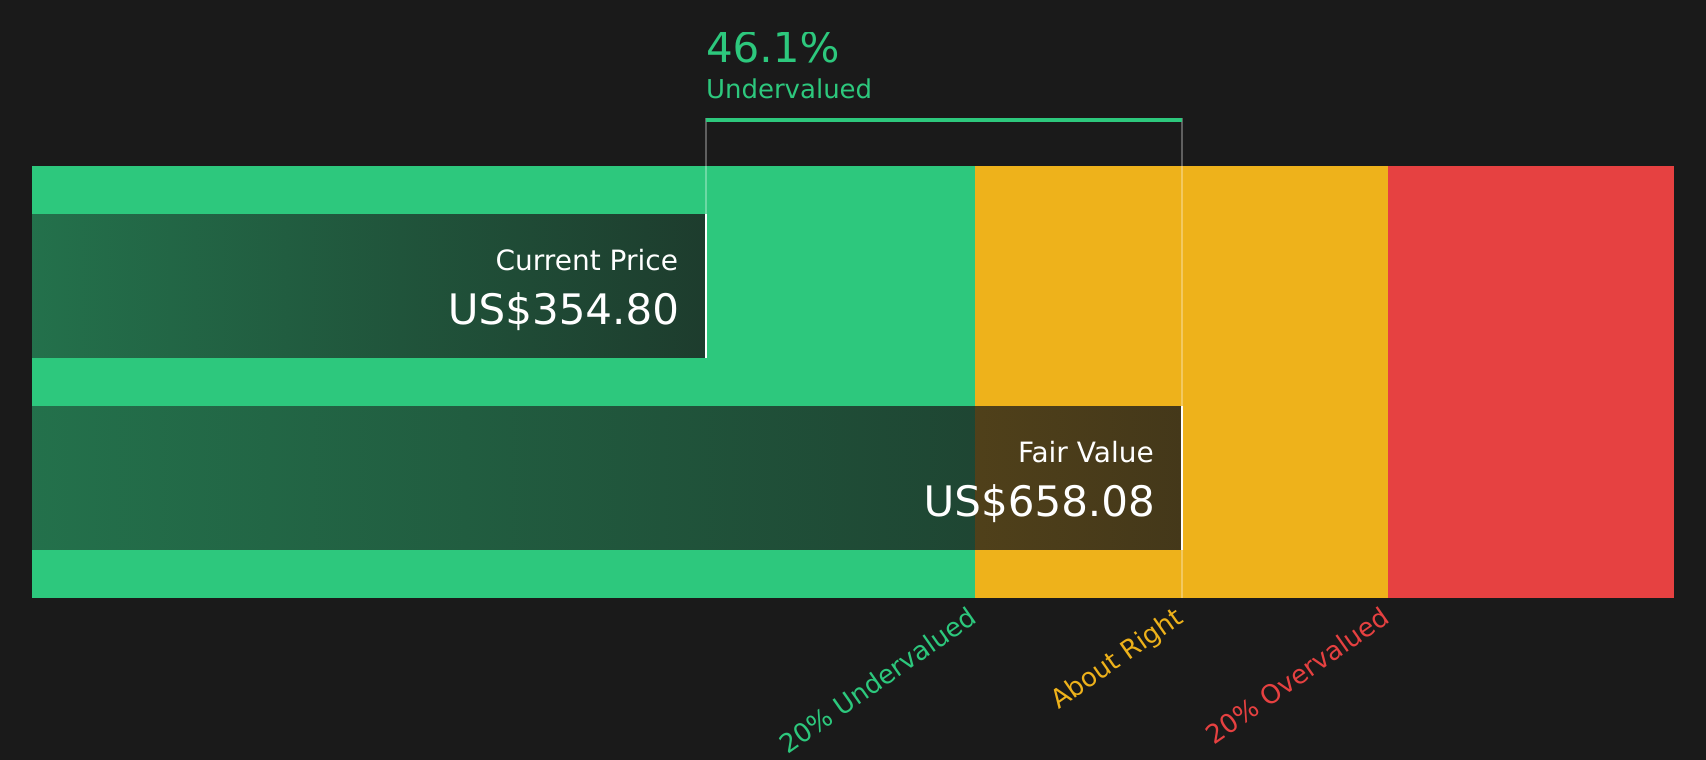
The analysis also uses a Stable Book Value of $228.59 per share, sourced from weighted future Book Value estimates from 12 analysts. Combining these inputs, the Excess Returns framework points to an intrinsic value of about $655.92 per share. Compared with the recent share price around $328, the model implies the stock is roughly 49.9% undervalued.
Result: UNDERVALUED
Our Excess Returns analysis suggests Chubb is undervalued by 49.9%. Track this in your watchlist or portfolio, or discover 58 more high quality undervalued stocks.
Approach 2: Chubb Price vs Earnings
For a profitable insurer like Chubb, the P/E ratio is a useful shorthand for how much you are paying for each dollar of earnings, which is why it is a common anchor for valuation work.
What counts as a “normal” P/E depends on how fast earnings are expected to grow and how risky those earnings are. Higher expected growth and lower perceived risk usually support a higher multiple, while slower growth or higher risk tend to pull a fair P/E down.
Chubb currently trades on a P/E of 12.38x. That sits above the Insurance industry average of 11.57x and above the peer group average of 8.97x. Simply Wall St’s Fair Ratio for Chubb is 11.83x, which is an estimate of what the P/E might be given factors such as its earnings growth profile, profit margins, industry, market cap and risk characteristics.
The Fair Ratio is more tailored than a simple comparison with peers or the industry, because it attempts to adjust for Chubb specific traits rather than assuming all insurers deserve the same multiple. Comparing the Fair Ratio of 11.83x with the current P/E of 12.38x suggests the shares are slightly above that modelled level.
Result: OVERVALUED

P/E ratios tell one story, but what if the real opportunity lies elsewhere? Start investing in legacies, not executives. Discover our 19 top founder-led companies.
Upgrade Your Decision Making: Choose your Chubb Narrative
Earlier it was mentioned that there is an even better way to understand valuation. This is where Narratives come in, a simple tool on Simply Wall St’s Community page that lets you attach a clear story about Chubb to your own forecast for revenue, earnings, margins and fair value. You can then compare that fair value to today’s price to decide whether the stock looks attractive or expensive. The platform updates your Narrative automatically as new news or earnings arrive. This means a cautious investor who leans on the consensus fair value near US$341.87 and expects earnings of about US$11.8b by 2029 can sit alongside a more optimistic investor who builds a Narrative using the higher US$13.4b earnings view and a different fair value, all using the same structure but different assumptions.
For Chubb however we will make it really easy for you with previews of two leading Chubb Narratives:
Fair value in this bull case narrative: US$341.87 per share.
Implied discount to that fair value at the recent US$328.42 price: about 3.9%.
Revenue growth assumption in this narrative: 6.36% annual decline.
- Analysts in this narrative see Chubb using international expansion, specialty lines and digital tools to support earnings, even while headline revenues are modelled to contract.
- Profit margins are assumed to widen, supported by disciplined underwriting, capital returns through dividends and buybacks, and a solid capital position.
- Key risks highlighted include competitive pressure on pricing, litigation and social inflation, catastrophe exposure, and regulatory headwinds that could challenge those margin assumptions.
Fair value in this bear case narrative: US$247.08 per share.
Implied premium to that fair value at the recent US$328.42 price: about 33.0%.
Revenue growth assumption in this narrative: 2.55% annually.
- This narrative focuses on Chubb as a mature global insurer where growth is steady rather than rapid, with a wide set of products and reinsurance helping spread risk.
- It places more weight on industry competition, regulatory complexity and the need for heavy capital and technology investment, which can cap the valuation multiple.
- The analysis also underlines exposure to market, credit, catastrophe and climate risks, arguing that these justify a more conservative fair value and required return.
To see how these and other views connect earnings forecasts, risks and valuation assumptions, and to decide which story fits your own expectations for Chubb, To see how these results tie into long-term growth, risks, and valuation, check out the full range of community narratives for Chubb on Simply Wall St. Add the company to your watchlist or portfolio so you'll be alerted when the story evolves.
Do you think there's more to the story for Chubb? Head over to our Community to see what others are saying!

This article by Simply Wall St is general in nature. We provide commentary based on historical data and analyst forecasts only using an unbiased methodology and our articles are not intended to be financial advice. It does not constitute a recommendation to buy or sell any stock, and does not take account of your objectives, or your financial situation. We aim to bring you long-term focused analysis driven by fundamental data. Note that our analysis may not factor in the latest price-sensitive company announcements or qualitative material. Simply Wall St has no position in any stocks mentioned.