Is It Too Late To Consider CNO Financial Group (CNO) After Strong Multi‑Year Share Gains?
CNO Financial Group, Inc. CNO | 0.00 |
- Wondering if CNO Financial Group at around US$46.82 is priced for what you are getting, or if the stock still leaves value on the table?
- The share price performance has been strong, with returns of 1.7% over the past week, 7.3% over the past month, 10.9% year to date, 23.2% over 1 year, 125.5% over 3 years and 93.6% over 5 years.
- Recent coverage of CNO Financial Group has focused on its position in the US insurance sector and how the business is responding to industry wide trends and regulatory developments. This news backdrop helps frame how the current share price might reflect shifting expectations and risk perceptions.
- CNO Financial Group currently holds a valuation score of 2 out of 6, so the next step is to look at what different valuation approaches say about the stock today and how a broader framework can give an even clearer picture by the end of this article.
CNO Financial Group scores just 2/6 on our valuation checks. See what other red flags we found in the full valuation breakdown.
Approach 1: CNO Financial Group Excess Returns Analysis
The Excess Returns model looks at how much profit a company can generate above the return that equity investors require, then capitalizes those surplus profits into a per share value.
For CNO Financial Group, the model uses a Book Value of $26.64 per share and a Stable EPS of $3.88 per share, based on weighted future Return on Equity estimates from 4 analysts. The implied Cost of Equity is $2.46 per share, so the estimated Excess Return is $1.42 per share, meaning earnings are projected to sit above the required return on capital.
The analysis also uses a Stable Book Value of $32.05 per share, based on weighted future Book Value estimates from 3 analysts, and an Average Return on Equity of 12.10%. Together, these inputs support an Excess Returns intrinsic value estimate of about $66.24 per share.
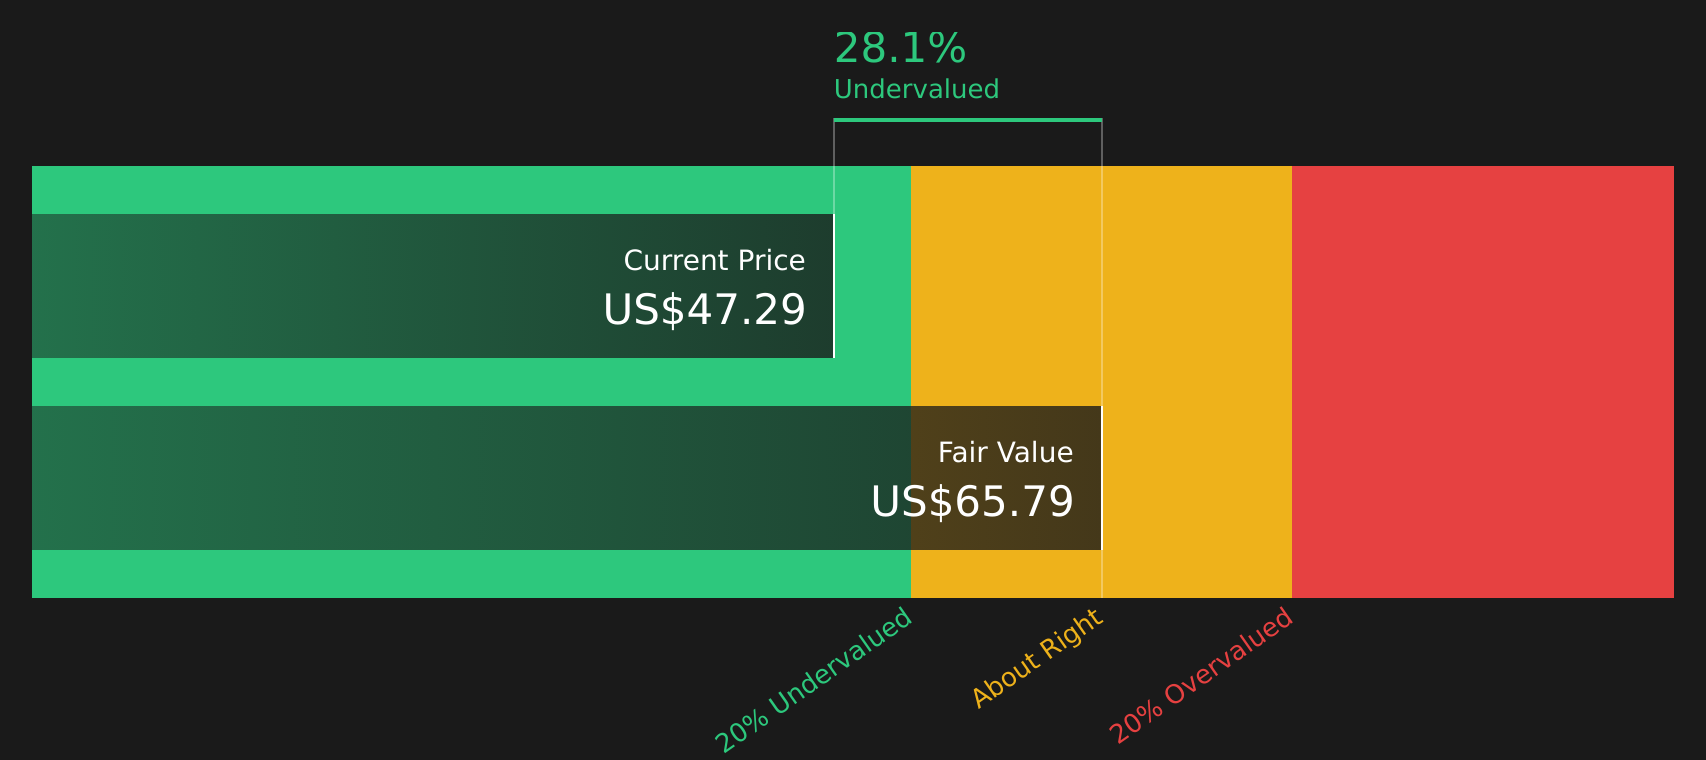
Compared with a recent share price around $46.82, this Excess Returns valuation implies the stock trades at roughly a 29.3% discount, which indicates the shares appear undervalued on this framework.
Result: UNDERVALUED
Our Excess Returns analysis suggests CNO Financial Group is undervalued by 29.3%. Track this in your watchlist or portfolio, or discover 51 more high quality undervalued stocks.
Approach 2: CNO Financial Group Price vs Earnings
For a profitable company like CNO Financial Group, the P/E ratio is a useful way to gauge how much you are paying for each dollar of earnings. The higher the expected growth and the lower the perceived risk, the more investors are usually willing to pay, which tends to support a higher P/E. When growth expectations are modest or risks feel higher, a lower P/E is often seen as more reasonable.
CNO Financial Group currently trades on a P/E of 17.80x. This sits above the Insurance industry average P/E of 11.05x and also above the peer average of 9.69x. Simply Wall St’s Fair Ratio for the stock is 15.07x, which reflects a proprietary view of what a more suitable P/E could be once factors such as earnings growth profile, profit margins, industry, market cap and risk characteristics are taken into account.
Compared with a simple peer or industry comparison, the Fair Ratio aims to adjust for these company specific features instead of assuming all insurers should trade on the same multiple. Lining up the current P/E of 17.80x against the Fair Ratio of 15.07x suggests the shares trade at a premium on this metric.
Result: OVERVALUED

P/E ratios tell one story, but what if the real opportunity lies elsewhere? Start investing in legacies, not executives. Discover our 19 top founder-led companies.
Upgrade Your Decision Making: Choose your CNO Financial Group Narrative
Earlier it was mentioned that there is an even better way to understand valuation, so Narratives are introduced as simple stories that connect your view of CNO Financial Group to specific assumptions about future revenue, earnings and margins, then convert that into a fair value that can be lined up against today’s price.
On Simply Wall St’s Community page, Narratives let you set your own fair value, plug in numbers such as profit margins and future P/E, and instantly see whether your view suggests the stock looks expensive or cheap compared to the current share price.
Because Narratives update when fresh information flows in, such as CNO Financial Group’s latest earnings, news on its dividend track record or analyst price targets between US$43.00 and US$53.00 with a consensus around US$47.50, you can quickly see how a more cautious view versus a more optimistic view leads to different fair values and therefore different decisions about when you might consider buying or selling.
Do you think there's more to the story for CNO Financial Group? Head over to our Community to see what others are saying!

This article by Simply Wall St is general in nature. We provide commentary based on historical data and analyst forecasts only using an unbiased methodology and our articles are not intended to be financial advice. It does not constitute a recommendation to buy or sell any stock, and does not take account of your objectives, or your financial situation. We aim to bring you long-term focused analysis driven by fundamental data. Note that our analysis may not factor in the latest price-sensitive company announcements or qualitative material. Simply Wall St has no position in any stocks mentioned.