Is It Too Late To Consider Commercial Metals (CMC) After A 50% One Year Gain?
Commercial Metals Company CMC | 0.00 |
- If you are wondering whether Commercial Metals stock still offers good value after its recent run, or if you may be late to the opportunity, this article addresses that question directly with a clear look at price relative to fundamentals.
- The stock last closed at US$71.25, with returns of 0.4% over 7 days, 9.8% over 30 days, a decline of 0.8% year to date, and gains of 50.1% over 1 year, 64.5% over 3 years, and 147.5% over 5 years.
- Recent share price moves are considered in the context of ongoing interest in metals and materials companies on Simply Wall St. Investors are watching how valuations compare with changing expectations for the sector. This article has been prepared to provide evergreen coverage of Commercial Metals so you can view those price moves within a clearer valuation framework.
- Commercial Metals currently has a valuation score of 5 out of 6. The sections that follow explain what that score reflects across different valuation methods and then conclude with a way to think about valuation that extends beyond any single model.
Approach 1: Commercial Metals Discounted Cash Flow (DCF) Analysis
A Discounted Cash Flow, or DCF, model estimates what a stock could be worth by projecting the company’s future cash flows and then discounting those back to today’s value using a required return. It focuses on cash the company can return to shareholders rather than accounting earnings.
For Commercial Metals, the model used is a 2 Stage Free Cash Flow to Equity approach based on cash flow projections. The latest twelve month Free Cash Flow is about $397.9 million. Analysts provide explicit forecasts for several years, with Simply Wall St extrapolating further projections out to 2035. Within these projections, Free Cash Flow is expected to reach $1,064.5 million in 2035, with interim years such as 2026 and 2028 at $387.3 million and $792.7 million respectively, all in dollar terms.
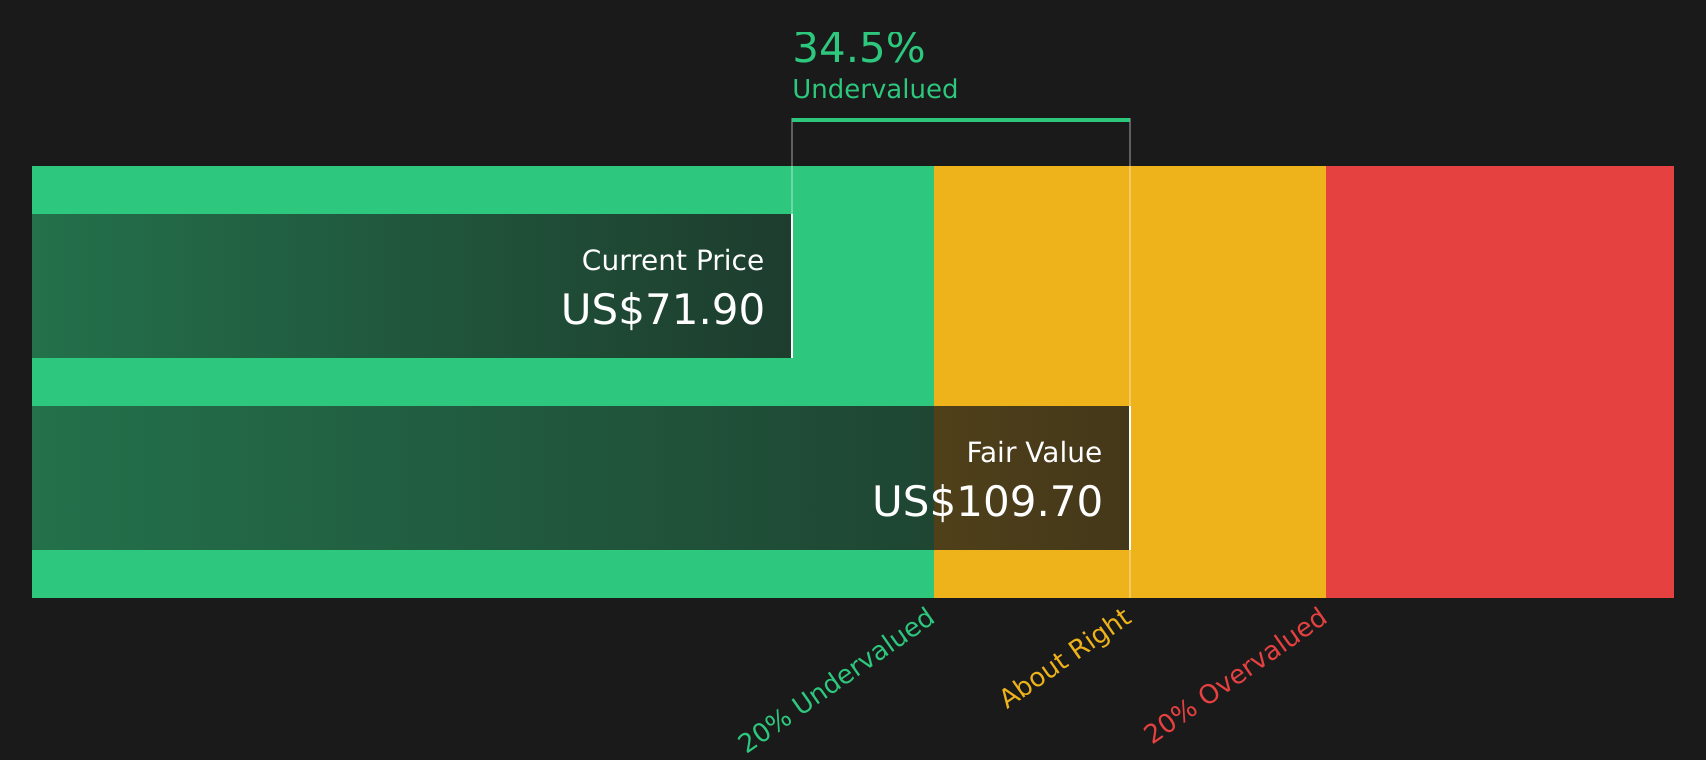
Discounting those future cash flows back to today yields an estimated intrinsic value of $109.92 per share. Compared with the recent share price of $71.25, this DCF output implies the stock trades at about a 35.2% discount. This points to a meaningful gap between the current price and the model’s value estimate.
Result: UNDERVALUED
Our Discounted Cash Flow (DCF) analysis suggests Commercial Metals is undervalued by 35.2%. Track this in your watchlist or portfolio, or discover 50 more high quality undervalued stocks.
Approach 2: Commercial Metals Price vs Earnings
For a profitable company, the P/E ratio is a straightforward way to connect the stock price with the earnings that support it. You are essentially asking how many dollars investors are willing to pay today for each dollar of current earnings.
What counts as a "normal" P/E depends on how the market views a company’s growth prospects and risk. Higher expected earnings growth or lower perceived risk can be associated with a higher P/E, while lower growth expectations or higher risk tend to align with a lower P/E.
Commercial Metals currently trades on a P/E of 15.64x. That sits below the Metals and Mining industry average of about 21.25x and also below the peer group average of 27.91x. Simply Wall St’s Fair Ratio for Commercial Metals is 19.53x, which is a proprietary estimate of the P/E that might be considered reasonable given factors such as its earnings profile, margins, industry, market value and risk characteristics.
The Fair Ratio can be more informative than a simple peer or industry comparison because it adjusts for the company’s specific growth, profitability, risk and size rather than assuming all companies should trade on the same multiple. With a current P/E of 15.64x versus a Fair Ratio of 19.53x, the stock screens as undervalued on this measure.
Result: UNDERVALUED

P/E ratios tell one story, but what if the real opportunity lies elsewhere? Start investing in legacies, not executives. Discover our 19 top founder-led companies.
Upgrade Your Decision Making: Choose your Commercial Metals Narrative
Earlier it was mentioned that there is a better way to understand valuation, so this is where Narratives come in as a simple way to connect the story you believe about Commercial Metals with your own forecast for revenue, earnings and margins, and then with a Fair Value that you can compare with today’s share price.
On Simply Wall St’s Community page, a Narrative is essentially your story written into the numbers, so you can set out how you think Commercial Metals’ business will develop, see what that implies for future cash flows and P/E, and then see whether that Fair Value sits above or below the current market price to help you decide whether the stock looks attractive, fairly priced or expensive on your view.
Narratives are also kept current as new earnings, news and valuation inputs are reflected in the models. You can see this clearly in the range of Narratives already published on Commercial Metals, from one that sets a Fair Value of US$85.00 with revenue growth of 8.23% and a future P/E of 16.39x, through to a more cautious view with Fair Value of US$69.00, revenue growth of 5.52% and a future P/E of 16.81x, as well as a middle ground Narrative with Fair Value of US$80.30 and a future P/E of 11.47x. Together these show how different assumptions lead to different valuations that you can compare with the current price.
For Commercial Metals however we'll make it really easy for you with previews of two leading Commercial Metals Narratives:
Fair Value: US$80.30
Gap to Fair Value: trades at about an 11.2% discount to this narrative fair value on the latest close.
Revenue Growth Assumption: 9.41% per year
- Focuses on Commercial Metals using programs like TAG and new mills in Arizona and West Virginia to improve efficiency and support earnings.
- Assumes revenue grows in the mid single digits each year, with profit margins moving higher over time if projects and cost controls stay on track.
- Highlights that analyst targets cluster around a fair value near US$80, while reminding you to test those assumptions against your own view on demand, margins and execution risks.
Fair Value: US$69.00
Gap to Fair Value: trades at about a 3.3% premium to this narrative fair value on the latest close.
Revenue Growth Assumption: 5.52% per year
- Frames Commercial Metals as more exposed to slower steel demand, global overcapacity and higher compliance costs that could pressure margins.
- Builds in lower revenue growth and a slimmer margin profile, even while allowing for ongoing buybacks and a higher future P/E than today.
- Suggests fair value closer to US$69, so you would need to believe in modest growth and tighter profitability to align with this more cautious stance.
Both Narratives use the same business facts but different expectations for growth, margins and valuation multiples. They give you a practical range to compare against the current share price and your own view of how Commercial Metals is likely to perform.
Do you think there's more to the story for Commercial Metals? Head over to our Community to see what others are saying!

This article by Simply Wall St is general in nature. We provide commentary based on historical data and analyst forecasts only using an unbiased methodology and our articles are not intended to be financial advice. It does not constitute a recommendation to buy or sell any stock, and does not take account of your objectives, or your financial situation. We aim to bring you long-term focused analysis driven by fundamental data. Note that our analysis may not factor in the latest price-sensitive company announcements or qualitative material. Simply Wall St has no position in any stocks mentioned.