Is It Too Late To Consider Delta Air Lines (DAL) After Recent Sector Price Swings?
Delta Air Lines, Inc. DAL | 69.89 | -2.92% |
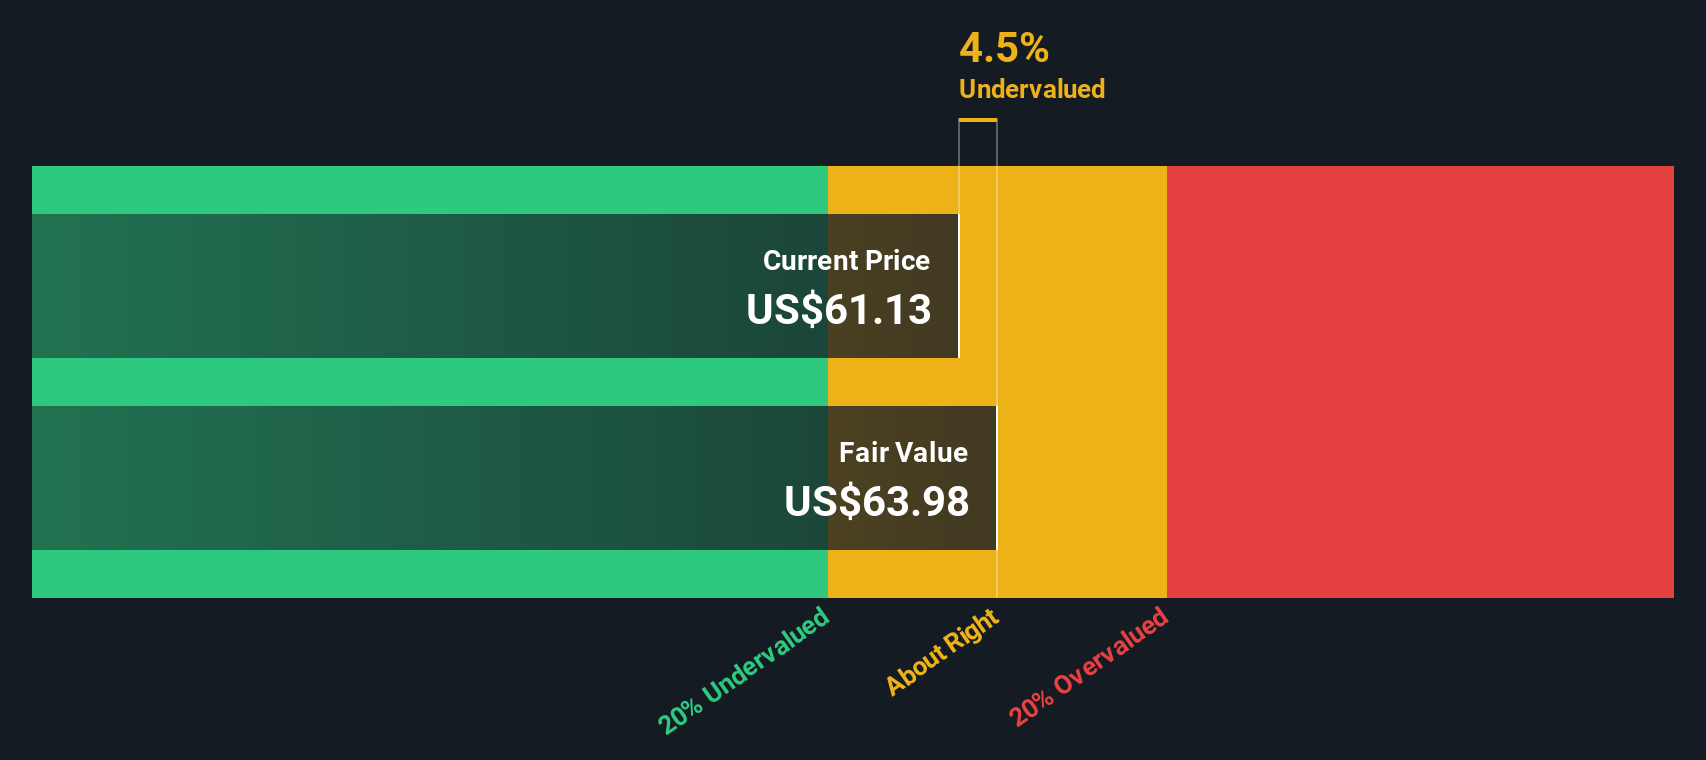
- Wondering if Delta Air Lines at around US$69.78 is offering you good value right now, or if most of the upside has already been priced in.
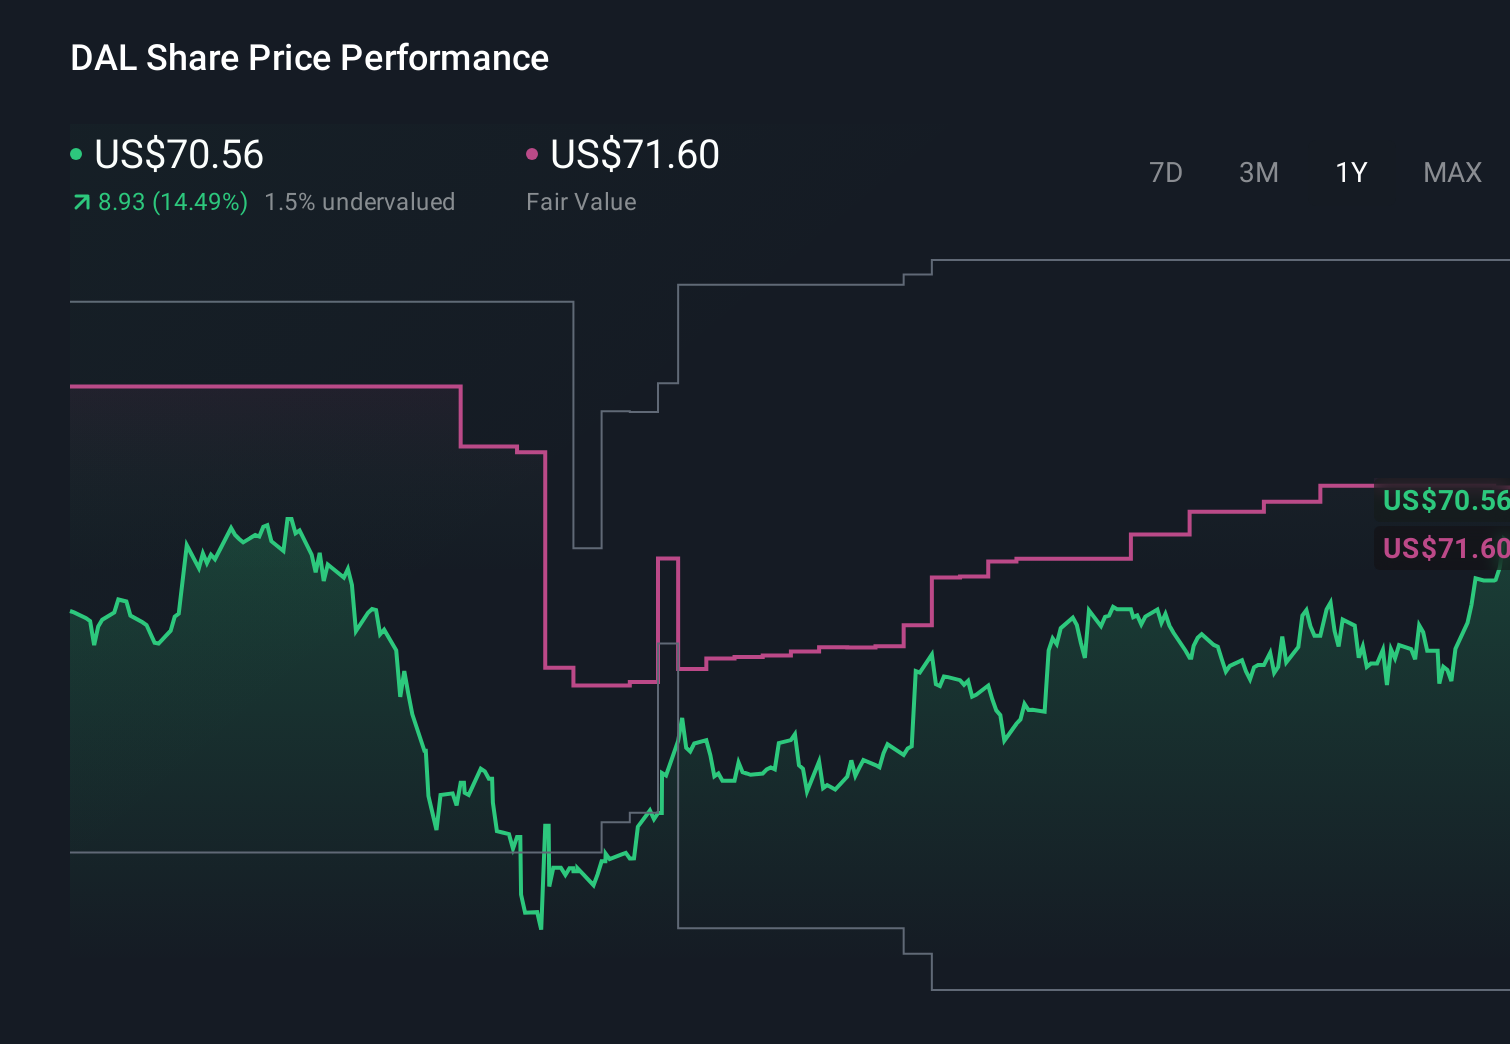
- The stock has delivered a 4.9% return over the last 7 days, a 3.4% decline over 30 days, is up 1.0% year to date, and has returned 4.0% over 1 year and 83.9% over 3 years, with a 67.9% return over 5 years providing useful longer term context.
- Recent price moves have come as investors continue to react to sector wide developments in aviation, including changing travel demand trends and shifting views on capacity and cost pressures. These themes help frame whether the current share price reflects cautious sentiment, renewed optimism, or something in between.
- On Simply Wall St's valuation checks, Delta Air Lines scores 5 out of 6. This sets up a closer look at how methods like discounted cash flow, multiples, and other tools stack up, and how an even more holistic way of thinking about value ties everything together later in this article.
Approach 1: Delta Air Lines Discounted Cash Flow (DCF) Analysis
A Discounted Cash Flow, or DCF, model takes estimates of a company’s future cash flows and discounts them back to today, aiming to translate those projections into a single estimate of what the business might be worth right now.
For Delta Air Lines, the latest twelve months free cash flow is about $2.39b. Analysts have provided explicit forecasts out to 2029, with Simply Wall St extending the series using its own assumptions to create a 2 Stage Free Cash Flow to Equity model. Within those projections, forecast free cash flow reaches $4.98b in 2029, with intermediate years such as 2026 and 2027 sitting in the $3.22b to $4.43b range before the extrapolated outer years.
Discounting all of those forecast cash flows back to today results in an estimated intrinsic value of about $126.90 per share. Compared with the recent share price around $69.78, the model suggests the stock trades at roughly a 45.0% discount. This indicates an undervalued reading based on this approach alone.
Result: UNDERVALUED
Our Discounted Cash Flow (DCF) analysis suggests Delta Air Lines is undervalued by 45.0%. Track this in your watchlist or portfolio, or discover 55 more high quality undervalued stocks.
Approach 2: Delta Air Lines Price vs Earnings
P/E is a common way to think about value for companies that are generating profits, because it links what you pay per share directly to the earnings that each share represents. In general, higher growth expectations or lower perceived risk can support a higher “normal” P/E ratio, while slower growth or higher risk tend to line up with a lower P/E.
Delta Air Lines currently trades on a P/E of about 9.04x. That sits close to the Airlines industry average of about 9.51x, and well below the broader peer average of around 41.34x. On the surface, that suggests the market is valuing Delta’s earnings in line with the sector, and at a discount to a wider group of peers.
Simply Wall St’s “Fair Ratio” for Delta is 15.98x. This is a proprietary estimate of what the P/E might be given the company’s earnings growth profile, profit margins, industry, market cap and risk factors. Because it blends these elements, it can be more tailored than a simple comparison to industry or peer averages, which treat all companies in the group the same.
With a Fair Ratio of 15.98x versus a current P/E of 9.04x, Delta Air Lines appears undervalued on this metric.
Result: UNDERVALUED

P/E ratios tell one story, but what if the real opportunity lies elsewhere? Start investing in legacies, not executives. Discover our 22 top founder-led companies.
Upgrade Your Decision Making: Choose your Delta Air Lines Narrative
Earlier we mentioned that there is an even better way to understand valuation, so let us introduce you to Narratives, which are simply your own story about a company that you connect to numbers like fair value, future revenue, earnings and margins.
A Narrative links what you believe about a business to a financial forecast, then to a fair value that you can compare directly with the current share price to decide whether the stock looks attractive, fully priced or expensive to you.
On Simply Wall St, Narratives live inside the Community page and are designed to be easy to use. You can adjust a few key assumptions, see how fair value moves in real time as new information such as earnings or news arrives, and quickly check how your view compares to other investors.
For Delta Air Lines, one investor might assume higher long term margins and arrive at a much higher fair value. Another might use more conservative revenue growth and a different discount rate and land on a meaningfully lower figure, which shows how the same stock can generate very different but clearly explained decisions.
Do you think there's more to the story for Delta Air Lines? Head over to our Community to see what others are saying!
This article by Simply Wall St is general in nature. We provide commentary based on historical data and analyst forecasts only using an unbiased methodology and our articles are not intended to be financial advice. It does not constitute a recommendation to buy or sell any stock, and does not take account of your objectives, or your financial situation. We aim to bring you long-term focused analysis driven by fundamental data. Note that our analysis may not factor in the latest price-sensitive company announcements or qualitative material. Simply Wall St has no position in any stocks mentioned.