Is It Too Late To Consider Diamondback Energy (FANG) After Recent Shale Discipline Focus?
Diamondback Energy, Inc. FANG | 0.00 |
- Wondering if Diamondback Energy's share price still offers value after a strong run, or if most of the opportunity is already priced in.
- The stock closed at US$195.08, with a 7 day return of a 5.1% decline, a 30 day return of a 0.2% decline, a 28.1% return year to date, and a 47.2% return over the last year. These figures can affect how you think about both upside potential and risk today.
- Recent news around US shale producers has kept attention on oil supply discipline and capital returns to shareholders, putting companies like Diamondback Energy under a brighter spotlight. That context helps explain why some investors are focusing more on price levels and less on short term trading moves.
- Diamondback Energy currently has a valuation score of 4/6. The next sections will walk through how that score is built using different valuation approaches, before finishing with a way to think about value that goes beyond any single model.
Approach 1: Diamondback Energy Discounted Cash Flow (DCF) Analysis
A Discounted Cash Flow, or DCF, model projects a company’s future cash flows and then discounts them back to today to estimate what the entire business might be worth in present value terms.
For Diamondback Energy, the model used is a 2 Stage Free Cash Flow to Equity approach, based on cash flow projections. The latest twelve month free cash flow stands at about $1.11b. Analyst estimates and extrapolations suggest annual free cash flows reaching around $6.41b by 2035, with intermediate projections such as $7.30b for 2026 and $6.13b for 2030, all in $ and then discounted back to today.
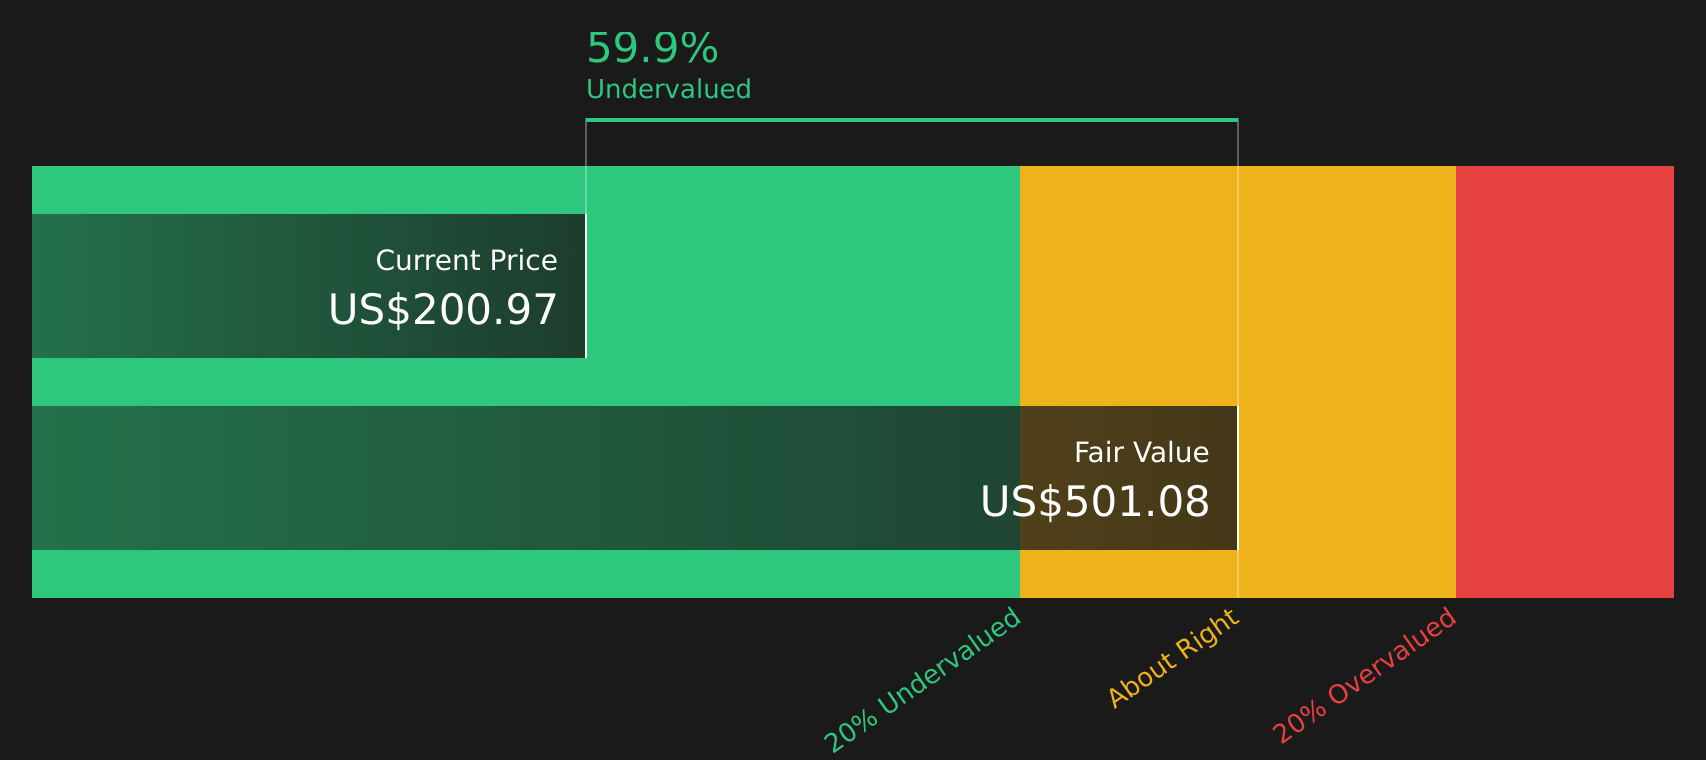
When these projected cash flows are aggregated and discounted, the model produces an estimated intrinsic value of about $491.68 per share. Compared with the recent share price of $195.08, this implies the stock is 60.3% below the modelled value. This indicates a wide gap between the cash flow based estimate and where the market is currently pricing the stock.
Result: UNDERVALUED
Our Discounted Cash Flow (DCF) analysis suggests Diamondback Energy is undervalued by 60.3%. Track this in your watchlist or portfolio, or discover 44 more high quality undervalued stocks.
Approach 2: Diamondback Energy Price vs Sales
For profitable companies that generate meaningful revenue, the P/S ratio is a useful way to see how much investors are paying for each dollar of sales, especially in sectors where earnings can be more volatile than revenue.
What counts as a “normal” or “fair” P/S ratio depends on factors like growth expectations and risk. Higher expected growth or lower perceived risk can justify a higher multiple, while slower growth or higher risk tends to line up with a lower P/S.
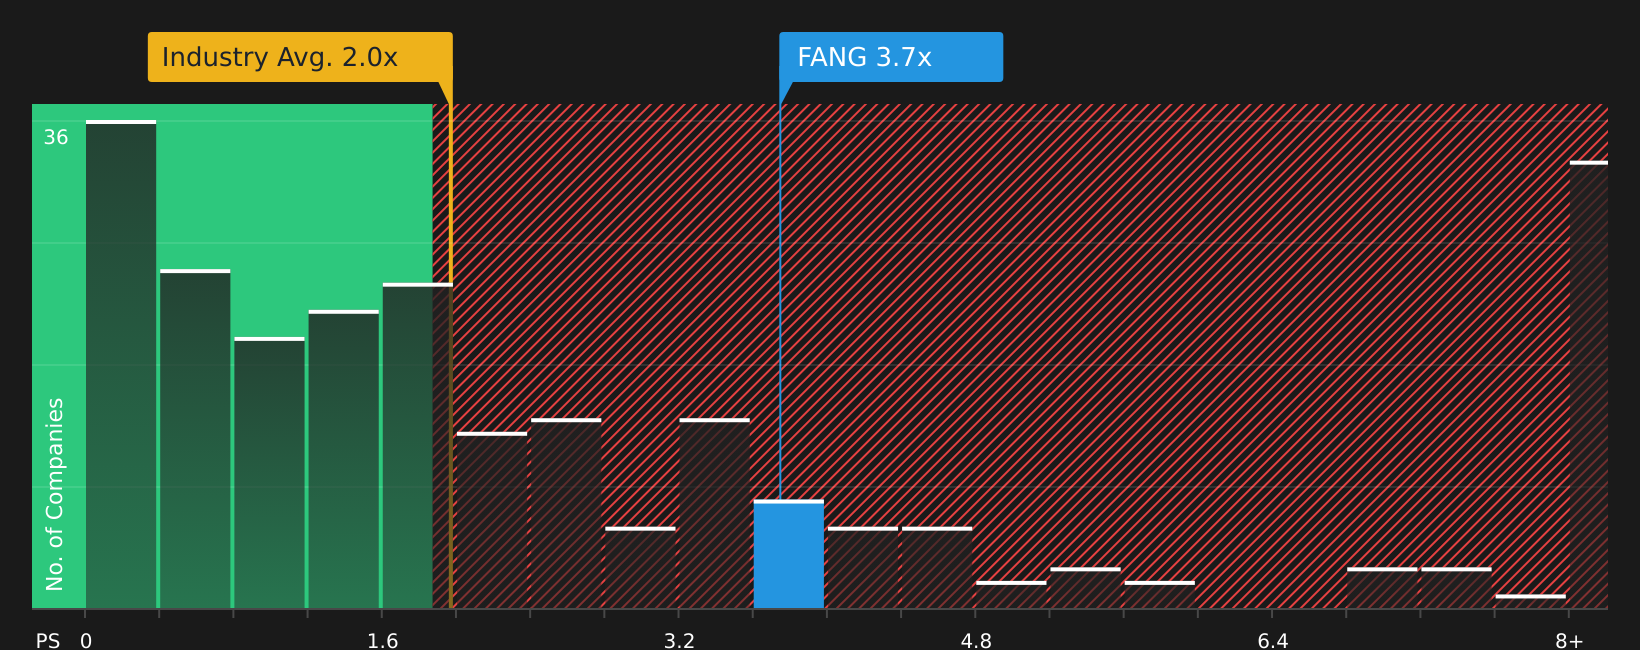
Diamondback Energy currently trades on a P/S ratio of 3.79x. That sits above the Oil and Gas industry average of 2.07x, yet below a peer group average of 11.32x. Simply Wall St’s Fair Ratio for Diamondback Energy stands at 4.11x. This is its proprietary view of what a reasonable P/S might be after accounting for earnings growth, profit margins, industry, market cap and key risks.
This Fair Ratio can be more informative than a simple peer or industry comparison because it adjusts for company specific qualities instead of assuming all stocks deserve the same multiple. Against this Fair Ratio of 4.11x, the current 3.79x P/S suggests Diamondback Energy screens as undervalued on this metric.
Result: UNDERVALUED
P/S ratios tell one story, but what if the real opportunity lies elsewhere? Start investing in legacies, not executives. Discover our 19 top founder-led companies.
Upgrade Your Decision Making: Choose your Diamondback Energy Narrative
Earlier it was mentioned that there is an even better way to understand valuation, so Narratives are introduced here as a simple way for you to attach a clear story about Diamondback Energy to the numbers by linking your view of its future revenue, earnings and margins to a financial forecast, then to a Fair Value that you can compare with the current price. All of this is available within an easy to use tool on Simply Wall St's Community page that updates automatically when new news or earnings arrive. It can reflect very different perspectives, such as a more cautious view anchored around a Fair Value of about US$175.39 or a more optimistic view anchored around about US$257.44.
For Diamondback Energy however we will make it really easy for you with previews of two leading Diamondback Energy Narratives:
On one side is a bullish, higher fair value view that leans on consolidation benefits, cash flow strength and capital returns. On the other is a more cautious stance that gives more weight to execution risks, cost pressures and what happens if valuation expectations prove too optimistic.
Here is how those two narratives stack up so you can decide which story feels closer to your own expectations.
Fair value: US$222.70
Implied undervaluation versus the recent US$195.08 share price: 12.4%
Revenue growth assumption: 3.1%
- Focuses on Permian consolidation, efficiency gains and use of emerging zones in existing acreage to support margins, free cash flow and production over time.
- Assumes improving profit margins, rising earnings to about US$4.2b by 2029 and ongoing share count reduction, with a future P/E of 16.3x used in the fair value work.
- Flags risks around higher operating costs, oil price volatility, inventory quality and limits to further acquisition driven growth, which could pressure margins and cash returns.
Fair value: US$175.39
Implied overvaluation versus the recent US$195.08 share price: 11.2%
Revenue growth assumption: 0.6%
- Takes a more restrained view on growth, with fairly flat revenue expectations and a focus on capital efficiency, lower breakeven pricing and SimulFRAC benefits to support earnings.
- Builds in earnings of about US$3.0b by 2029 and a higher future P/E of 18.3x, while still assuming share count declines, which together underpin the lower fair value.
- Highlights dependence on continued scale efficiencies, successful asset sales and power cost management, along with the risk that heavy use of buybacks and acquisition activity leaves less room if conditions turn less favorable.
If neither story fully matches your own expectations for oil prices, drilling inventory quality or capital returns, use them as reference points and adjust the key inputs until the numbers line up with your view of the stock.
Do you think there's more to the story for Diamondback Energy? Head over to our Community to see what others are saying!

This article by Simply Wall St is general in nature. We provide commentary based on historical data and analyst forecasts only using an unbiased methodology and our articles are not intended to be financial advice. It does not constitute a recommendation to buy or sell any stock, and does not take account of your objectives, or your financial situation. We aim to bring you long-term focused analysis driven by fundamental data. Note that our analysis may not factor in the latest price-sensitive company announcements or qualitative material. Simply Wall St has no position in any stocks mentioned.