Is It Too Late To Consider DuPont De Nemours (DD) After Its 68% One-Year Rally?
E. I. du Pont de Nemours and Company DD | 0.00 |
- Wondering whether DuPont de Nemours is still priced attractively after its recent run, or if the easy value has already been taken off the table.
- The stock last closed at US$46.24, with returns of 13.1% year to date and 67.8% over the past year, following a more muted 1.7% return over 30 days and a 0.2% slip over the last week.
- Recent news coverage has focused on DuPont de Nemours as a major name in the US materials space, with investors paying close attention to how the company positions itself within chemicals and advanced materials. This context helps explain why the share price performance has been on many investors' radar over the last year.
- On Simply Wall St's valuation checks, DuPont de Nemours scores 3 out of 6. The rest of this article will walk through what that means across common valuation methods and will point to an even richer way of thinking about value at the end.
Approach 1: DuPont de Nemours Discounted Cash Flow (DCF) Analysis
A Discounted Cash Flow, or DCF, model takes projected future cash flows and discounts them back to today to estimate what the business might be worth right now. It focuses on cash generated for shareholders rather than accounting profits.
For DuPont de Nemours, the model used is a 2 Stage Free Cash Flow to Equity approach. The latest twelve month free cash flow is about $1.09b. Analyst and extrapolated estimates suggest free cash flow of $922.7m in 2026 and $1.15b by 2029, with further projections extending out to 2035 based on Simply Wall St assumptions.
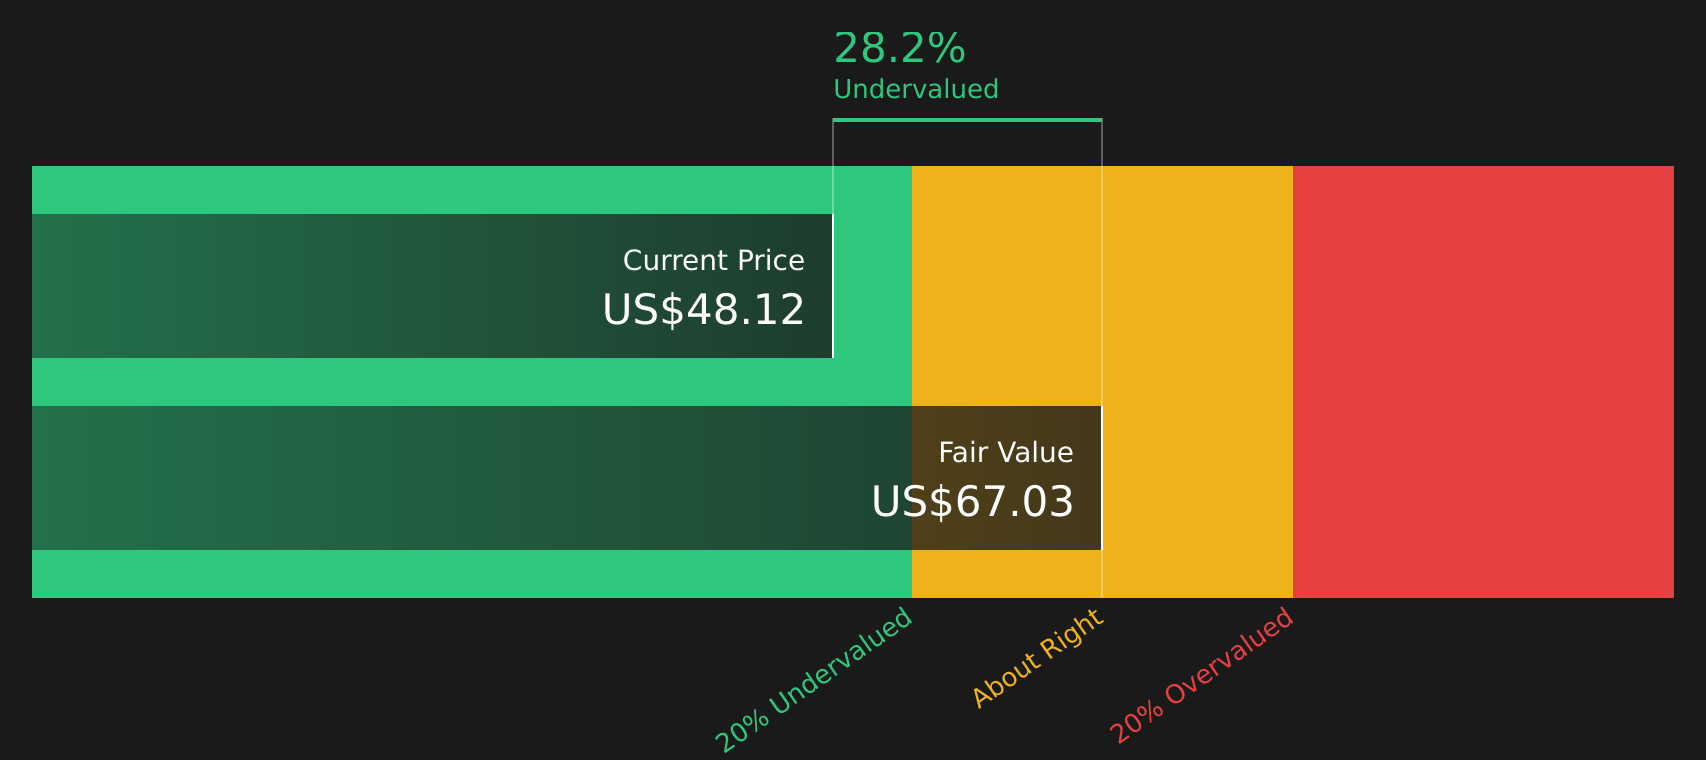
Discounting these projected cash flows back to today produces an estimated intrinsic value of about $64.48 per share. Compared with the recent share price of $46.24, this implies an intrinsic discount of 28.3%, which indicates the shares are trading at a meaningful gap to this DCF estimate.
Result: UNDERVALUED
Our Discounted Cash Flow (DCF) analysis suggests DuPont de Nemours is undervalued by 28.3%. Track this in your watchlist or portfolio, or discover 50 more high quality undervalued stocks.
Approach 2: DuPont de Nemours Price vs Sales
Approach 2: DuPont de Nemours Price vs Sales
For profitable and established companies, the P/S ratio is a useful way to see what investors are paying for each dollar of revenue, especially when earnings can be affected by one off items. It reflects how the market values the company’s sales today, without getting caught up in short term profit swings.
In general, higher growth expectations and lower perceived risk tend to justify a higher “normal” or “fair” P/S multiple, while slower growth or higher risk usually point to a lower multiple. So context really matters when you compare any stock’s P/S ratio to a simple average.
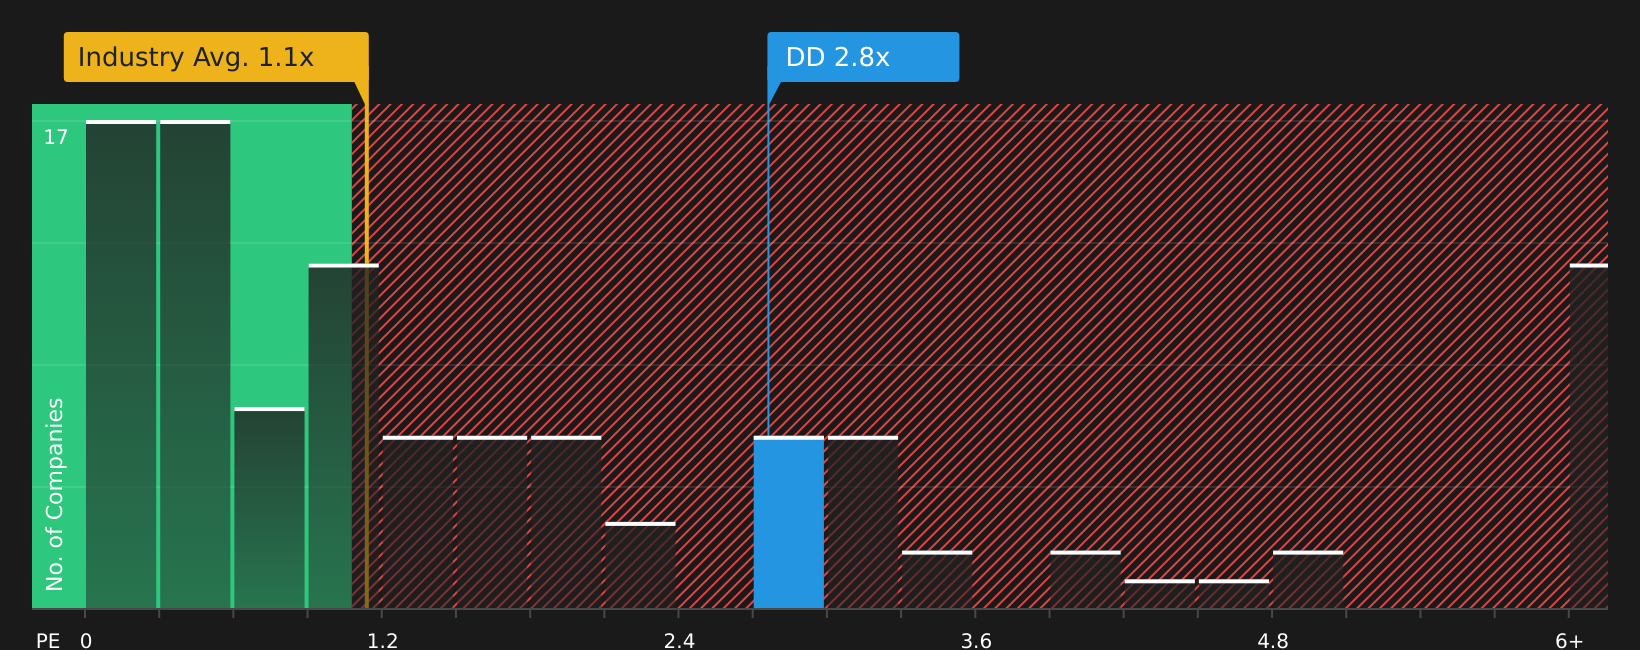
DuPont de Nemours currently trades on a P/S of 2.77x. That sits above the Chemicals industry average of 1.14x and the peer group average of 2.32x. Simply Wall St’s Fair Ratio for DuPont de Nemours is 2.87x, which is a proprietary estimate of what the P/S ratio might be given factors such as earnings growth profile, profit margins, industry, market cap and key risks.
This Fair Ratio is more tailored than a straight comparison with peers or the sector because it adjusts for company specific strengths and weaknesses rather than treating all chemical companies as the same. With the current P/S of 2.77x sitting very close to the 2.87x Fair Ratio, the shares look priced at around their estimated fair level on this measure.
Result: ABOUT RIGHT
P/S ratios tell one story, but what if the real opportunity lies elsewhere? Start investing in legacies, not executives. Discover our 17 top founder-led companies.
Upgrade Your Decision Making: Choose your DuPont de Nemours Narrative
Earlier this article pointed to a better way to think about valuation, and that is Narratives. With this approach, you attach a clear story about DuPont de Nemours to the numbers you care about, link that story to a forecast for revenue, earnings and margins, and then see a Fair Value you can compare with the current share price.
On Simply Wall St’s Community page, Narratives are an easy tool used by millions of investors. They allow you to pick or build a view that fits your own assumptions and then see in one place how that translates into a Fair Value that updates automatically as new earnings, guidance or news arrive.
For DuPont de Nemours, one Narrative might lean toward the higher Fair Value of US$64.00, based on expectations of revenue around US$7.8b, earnings of US$938.1m and a future P/E of 32.4x. Another might align with a lower Fair Value of US$50.00, using revenue of US$7.6b, earnings of US$814.4m and a future P/E of 29.1x. Your job as an investor is to decide which story feels more reasonable and how that stacks up against today’s price.
Do you think there's more to the story for DuPont de Nemours? Head over to our Community to see what others are saying!

This article by Simply Wall St is general in nature. We provide commentary based on historical data and analyst forecasts only using an unbiased methodology and our articles are not intended to be financial advice. It does not constitute a recommendation to buy or sell any stock, and does not take account of your objectives, or your financial situation. We aim to bring you long-term focused analysis driven by fundamental data. Note that our analysis may not factor in the latest price-sensitive company announcements or qualitative material. Simply Wall St has no position in any stocks mentioned.