هل فات الأوان للنظر في شركة FLEX LNG (FLNG) بعد ارتفاع سعر السهم بنسبة 59% خلال عام واحد؟
FLEX LNG LTD (BM) FLNG | 0.00 |
- إذا كنت تتساءل عما إذا كان سعر سهم شركة FLEX LNG الحالي لا يزال يمثل قيمة، فإن أداء السهم الأخير يمنحك الكثير للتفكير فيه.
- أغلق السهم مؤخرًا عند 30.47 دولارًا أمريكيًا، محققًا عوائد بلغت 0.9% خلال 7 أيام، و4.1% خلال 30 يومًا، و23.5% منذ بداية العام، و58.8% خلال العام الماضي. هذه الأرقام تجعل التحركات الأخيرة جديرة بالاهتمام عند تقييم المخاطر والعوائد.
- ركزت الأخبار الأخيرة المتعلقة بشركة FLEX LNG على دورها في قطاع شحن الغاز الطبيعي المسال، وكيف يتفاعل المستثمرون مع عناوين الأخبار الأوسع نطاقاً في هذا القطاع. وتساعد هذه التحديثات مجتمعةً في تحديد ما إذا كانت المعنويات الحالية تدعم سعر السهم أم أنها تترك مجالاً لإعادة تقييمه.
- تبلغ قيمة شركة FLEX LNG حاليًا 3/6 . وهذا يمهد الطريق لمقارنة طرق التقييم المختلفة لاحقًا، ثم سنتناول في المقال طريقة أكثر شمولًا لتقدير قيمة السهم.
النهج الأول: تحليل التدفقات النقدية المخصومة (DCF) لمشروع FLEX LNG
يقوم نموذج التدفقات النقدية المخصومة، أو DCF، بتقدير قيمة الشركة من خلال توقع تدفقاتها النقدية المستقبلية ثم خصمها إلى قيمتها الحالية.
بالنسبة لشركة FLEX LNG، بلغ التدفق النقدي الحر خلال الاثني عشر شهرًا الماضية حوالي 140.7 مليون دولار. وباستخدام نموذج التدفق النقدي الحر إلى حقوق الملكية على مرحلتين، تم توقع التدفقات النقدية على مدى العقد القادم، مع الأخذ في الاعتبار بيانات المحللين للأعوام السابقة وتوقعات إضافية من Simply Wall St. وبحلول عام 2035، يستخدم النموذج تدفقًا نقديًا حرًا مُقدَّرًا بـ 369.3 مليون دولار، مع خصم التدفق النقدي لكل عام ليعكس المخاطر والقيمة الزمنية للنقود.
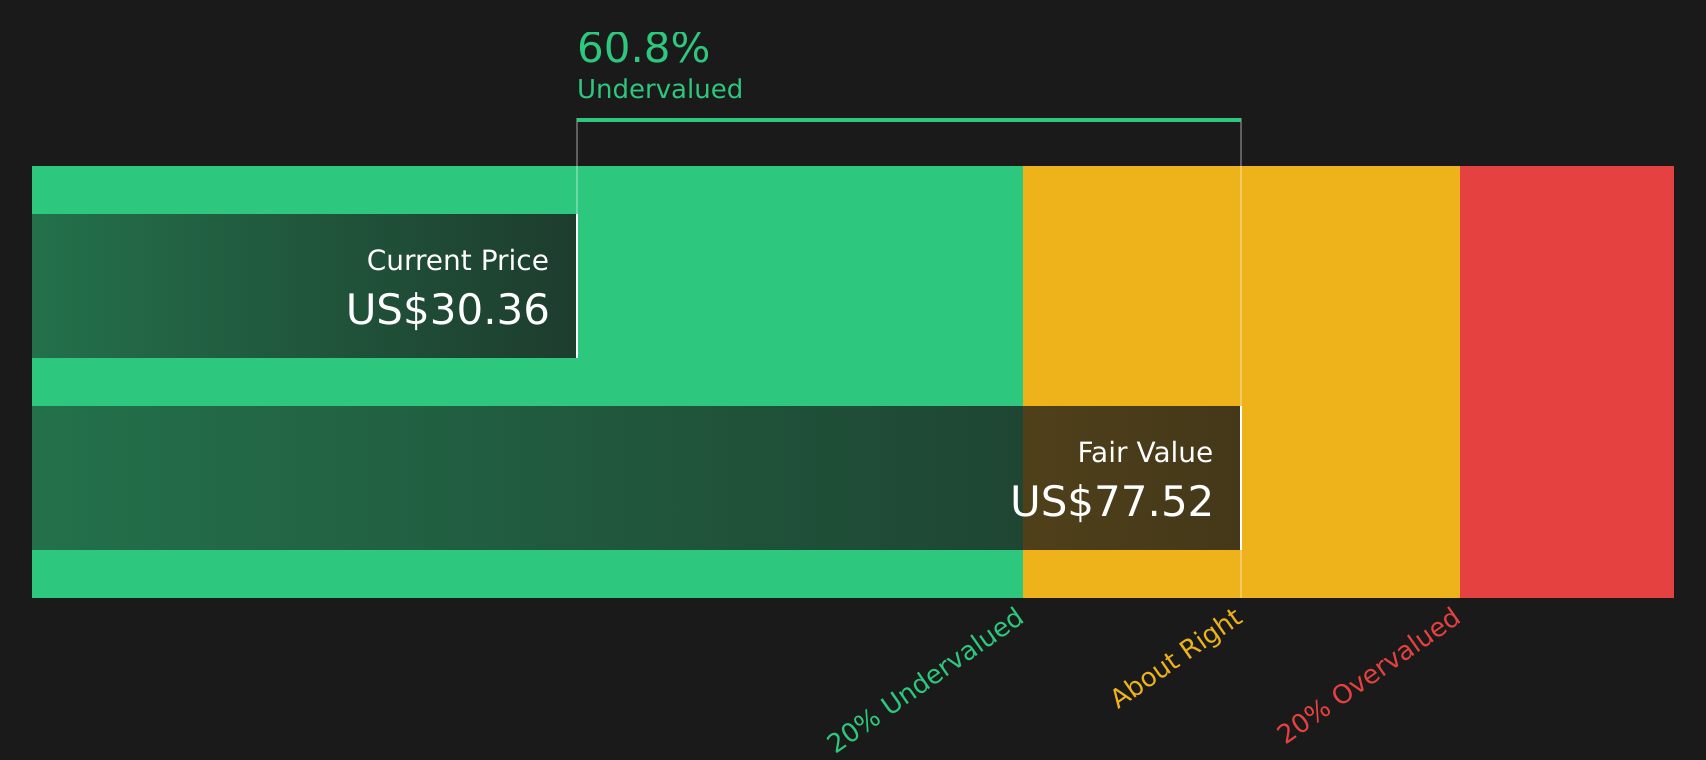
يُنتج جمع هذه التدفقات النقدية المخصومة قيمة جوهرية تقديرية تبلغ 108.73 دولارًا أمريكيًا للسهم الواحد. وبالمقارنة مع سعر السهم الحالي البالغ 30.47 دولارًا أمريكيًا، تشير هذه النتائج إلى أن سهم شركة FLEX LNG يُتداول بخصم 72.0% عن القيمة المُقدّرة. وهذا يدل على وجود فجوة كبيرة بين سعر السوق الحالي والتقدير القائم على التدفقات النقدية.
النتيجة: مُقَيَّم بأقل من قيمته الحقيقية
تشير تحليلاتنا للتدفقات النقدية المخصومة (DCF) إلى أن أسهم شركة FLEX LNG مقومة بأقل من قيمتها الحقيقية بنسبة 72.0%. تابع هذه الأسهم في قائمة مراقبتك أو محفظتك الاستثمارية ، أو اكتشف 62 سهماً آخر عالي الجودة مقوم بأقل من قيمته الحقيقية .
النهج الثاني: سعر الغاز الطبيعي المسال المرن مقابل الأرباح
بالنسبة لشركة مربحة مثل FLEX LNG، يُعدّ مُضاعف الربحية (P/E) أداةً مفيدةً لفهم العائد على الاستثمار لكل دولار من الأرباح. وعادةً ما يقبل المستثمرون مُضاعف ربحية أعلى أو أقل بناءً على توقعاتهم لنمو الأرباح المستقبلية ومستوى المخاطر التي يرونها في هذه الأرباح.
يتم تداول أسهم شركة FLEX LNG حاليًا بنسبة سعر إلى ربحية تبلغ 22.0 ضعفًا. وهذا أعلى من متوسط نسبة السعر إلى الربحية في قطاع النفط والغاز البالغ 15.6 ضعفًا، وأعلى أيضًا من متوسط النسبة في الشركات المنافسة البالغ 13.9 ضعفًا. يشير هذا إلى أن السوق يمنح شركة FLEX LNG مضاعف ربحية أعلى من العديد من الشركات المنافسة في القطاع.
يبلغ مُضاعف الربحية العادل لشركة FLEX LNG، وفقًا لموقع Simply Wall St، 22.5 ضعفًا. هذا تقدير خاص لما قد يبدو عليه مُضاعف الربحية "الطبيعي" للشركة، مع الأخذ في الاعتبار عوامل مثل معدل نمو أرباحها، وهوامش الربح، وقطاعها، وقيمتها السوقية، وخصائص المخاطر. ولأنه يُعدّل هذه العوامل، يُمكن أن يكون مُضاعف الربحية العادل معيارًا أكثر دقة من مجرد المقارنة مع الشركات المنافسة أو القطاع ككل.
مع نسبة السعر إلى الأرباح الحالية عند 22.0x ونسبة القيمة العادلة عند 22.5x، يبدو أن تقييم شركة FLEX LNG بناءً على الأرباح قريب مما يشير إليه النموذج.
النتيجة: صحيح تقريبًا

نسبة السعر إلى الأرباح لا تعكس الصورة كاملة، ولكن ماذا لو كانت الفرصة الحقيقية تكمن في مكان آخر؟ ابدأ بالاستثمار في الشركات العريقة، لا في المديرين التنفيذيين. اكتشف أفضل 20 شركة يقودها مؤسسوها .
حسّن عملية اتخاذ قراراتك: اختر سردية FLEX LNG الخاصة بك
سبق أن ذكرنا أن هناك طريقة أفضل لتقييم الأسهم، وهي متوفرة في منصة Simply Wall St من خلال قسم "التحليلات". في صفحة "المجتمع"، يمكنك أنت والمستثمرون الآخرون تقديم تحليل واضح حول شركة FLEX LNG، مع توضيح توقعاتكم للإيرادات والأرباح وهوامش الربح المستقبلية، والقيمة العادلة الناتجة التي تُقارن بسعر السهم الحالي لتحديد ما إذا كان السهم جذابًا أم مُبالغًا في سعره. يتم تحديث هذه التحليلات تلقائيًا عند إضافة معلومات جديدة، مثل الأخبار أو الأرباح، وقد تختلف بشكل كبير. على سبيل المثال، قد يستخدم أحد المستثمرين متوسط القيمة العادلة المُجمعة من قِبل المحللين، والذي يبلغ حوالي 26.13 دولارًا أمريكيًا، ويرى أن سعر السهم مُناسب تمامًا، بينما قد يُركز مستثمر آخر على حجم العقود المتراكمة للشركة ويستخدم توقعات هوامش ربح أعلى على المدى الطويل لدعم قيمة عادلة أعلى بشكل ملحوظ.
هل تعتقد أن هناك المزيد من التفاصيل حول مشروع FLEX LNG؟ تفضل بزيارة مجتمعنا للاطلاع على آراء الآخرين!

هذا المقال من Simply Wall St ذو طبيعة عامة. نقدم تعليقاتنا بناءً على البيانات التاريخية وتوقعات المحللين فقط، باستخدام منهجية محايدة، ولا يُقصد بمقالاتنا أن تكون نصائح مالية. لا يُشكل هذا المقال توصيةً بشراء أو بيع أي سهم، ولا يأخذ في الاعتبار أهدافك أو وضعك المالي. نهدف إلى تزويدك بتحليلات طويلة الأجل مدفوعة بالبيانات الأساسية. يُرجى ملاحظة أن تحليلنا قد لا يأخذ في الاعتبار آخر إعلانات الشركات الحساسة للسعر أو المعلومات النوعية. لا تمتلك Simply Wall St أي أسهم في أي من الشركات المذكورة.