Is It Too Late To Consider Golar LNG (GLNG) After A 50% Year-To-Date Surge?
Golar LNG Limited GLNG | 0.00 |
- Many investors are considering whether Golar LNG is fairly priced at its current level, or whether the stock still offers value for new money going in.
- The stock last closed at US$57.04, with returns of 2.4% over the past week, 6.0% over the past month, 50.3% year to date and 47.9% over the past year. These moves may have influenced how investors view its potential and risk.
- Recent coverage has focused on Golar LNG's positioning within the energy sector and on how investors are reacting to its capital allocation decisions and project pipeline. These headlines help explain why the share price has been so active, and they frame the question of whether the current price still lines up with underlying fundamentals.
- Golar LNG currently has a valuation score of 2 out of 6. The next sections will break down what different valuation approaches indicate about the stock, and then conclude with a way to combine those methods into a clearer big-picture view.
Golar LNG scores just 2/6 on our valuation checks. See what other red flags we found in the full valuation breakdown.
Approach 1: Golar LNG Discounted Cash Flow (DCF) Analysis
The Discounted Cash Flow model estimates what a stock could be worth today by projecting its future cash flows and then discounting those cash flows back to a present value.
For Golar LNG, the model used is a 2 Stage Free Cash Flow to Equity approach, based on cash flow projections expressed in $. The latest twelve month free cash flow shows a loss of $197.31 million. Analyst and extrapolated projections then move from further free cash flow losses in 2026 and 2027 to positive free cash flow of $245.00 million in 2028, reaching $617.46 million by 2035, with intermediate years filled by Simply Wall St estimates.
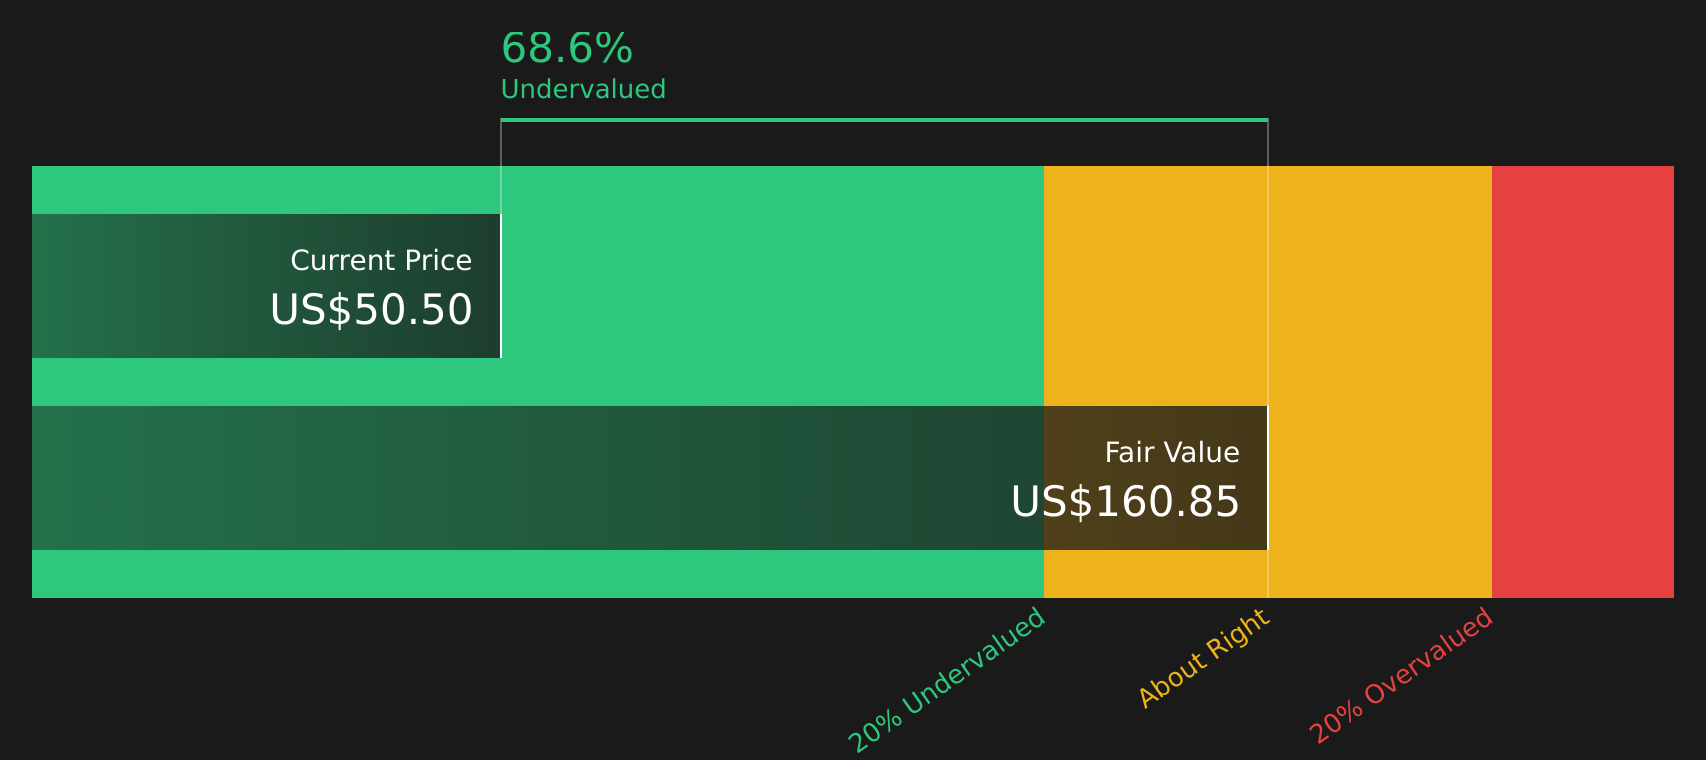
Putting these projected cash flows through the DCF model gives an estimated intrinsic value of $101.60 per share. Compared with the recent share price of $57.04, this indicates that the stock is trading at an implied 43.9% discount, meaning the market price is below the modelled cash flow value.
Result: UNDERVALUED
Our Discounted Cash Flow (DCF) analysis suggests Golar LNG is undervalued by 43.9%. Track this in your watchlist or portfolio, or discover 49 more high quality undervalued stocks.
Approach 2: Golar LNG Price vs Earnings
For profitable companies, the P/E ratio is a common way to think about value because it links what you pay for the stock to the earnings the business is currently generating. A higher P/E can sometimes reflect higher expected growth or lower perceived risk, while a lower P/E can reflect lower growth expectations or higher risk.
Golar LNG trades on a P/E of 88.38x. This compares with an Oil and Gas industry average P/E of 14.53x and a peer average of 21.24x. On those simple comparisons, the stock carries a much higher valuation multiple than many industry peers.
Simply Wall St’s Fair Ratio metric aims to refine this picture. It estimates what a more tailored P/E could look like for Golar LNG by considering factors such as earnings growth, risks, profit margins, industry and market cap. Because it is specific to the company, the Fair Ratio of 33.82x can be more informative than broad industry or peer averages.
Set against the current P/E of 88.38x, the Fair Ratio suggests the stock is trading at a higher multiple than the company specific drivers would imply.
Result: OVERVALUED

P/E ratios tell one story, but what if the real opportunity lies elsewhere? Start investing in legacies, not executives. Discover our 19 top founder-led companies.
Upgrade Your Decision Making: Choose your Golar LNG Narrative
Earlier it was mentioned that there is an even better way to understand valuation, so this is where Narratives come in as a simple story that you attach to the numbers such as your view on Golar LNG’s future revenue, earnings and margins. This then flows through to a forecast and a fair value you can compare with today’s price.
On Simply Wall St’s Community page, Narratives let you set out your view in plain language, link it to explicit forecasts and a fair value, and then see how that stacks up against the current share price so you can judge whether you see the stock as offering value or looking expensive at any point in time.
These Narratives update automatically as new news, earnings or guidance comes through, so your fair value view can keep pace with fresh information without you rebuilding a model from scratch every time.
For Golar LNG, for example, one investor might align with the higher fair value around US$66.0 based on stronger growth and margin assumptions, while another might sit closer to the lower fair value near US$44.5. Seeing those views side by side can help you decide which story and pricing feels more realistic to you.
For Golar LNG, here are previews of two leading Golar LNG narratives to make comparison easier:
Fair value in this bullish narrative: US$66.00 per share
Implied pricing versus this fair value: trading at about 13.6% below that figure based on the recent US$57.04 close
Revenue growth assumption: 33.53% per year
- Focuses on three FLNG vessels on 20 year contracts with about US$17b of EBITDA backlog and most operating costs reimbursable, which supports contracted earnings and free cash flow.
- Builds in higher revenue and margin expectations from LNG projects in Argentina, Mauritania and Senegal, plus commodity linked upside and the Southern Energy stake.
- Assumes that conversion expertise, access to funding and additional FLNG projects justify a higher earnings base by 2029 and a P/E of 22.0x on those earnings.
Fair value in this more conservative narrative: US$53.31 per share
Implied pricing versus this fair value: trading at about 7.0% above that figure based on the recent US$57.04 close
Revenue growth assumption: 29.27% per year
- Sees long term FLNG contracts and about US$17b of contracted EBITDA as supportive for earnings, but closer to a fair value around the analyst consensus target.
- Assumes strong but slightly lower revenue and margin expansion than the bullish case, with earnings modeled at US$308.0m and a 19.7x P/E by 2029.
- Highlights that reliance on LNG demand, large contracts and capital intensive FLNG expansion could limit upside if contract terms, refinancing or sector conditions turn less favorable.
If you want to read each view in full before making up your own mind, start with these community narratives for Golar LNG and then compare the assumptions with your expectations for LNG demand, contract risk and future returns on new FLNG projects.
Do you think there's more to the story for Golar LNG? Head over to our Community to see what others are saying!

This article by Simply Wall St is general in nature. We provide commentary based on historical data and analyst forecasts only using an unbiased methodology and our articles are not intended to be financial advice. It does not constitute a recommendation to buy or sell any stock, and does not take account of your objectives, or your financial situation. We aim to bring you long-term focused analysis driven by fundamental data. Note that our analysis may not factor in the latest price-sensitive company announcements or qualitative material. Simply Wall St has no position in any stocks mentioned.