Is It Too Late To Consider MillerKnoll (MLKN) After Recent Share Price Rebound
MillerKnoll, Inc. MLKN | 16.27 | +0.43% |
- If you are wondering whether MillerKnoll at around US$21.78 still offers value or if the easy gains are gone, this article will explain what the current price reflects in more detail.
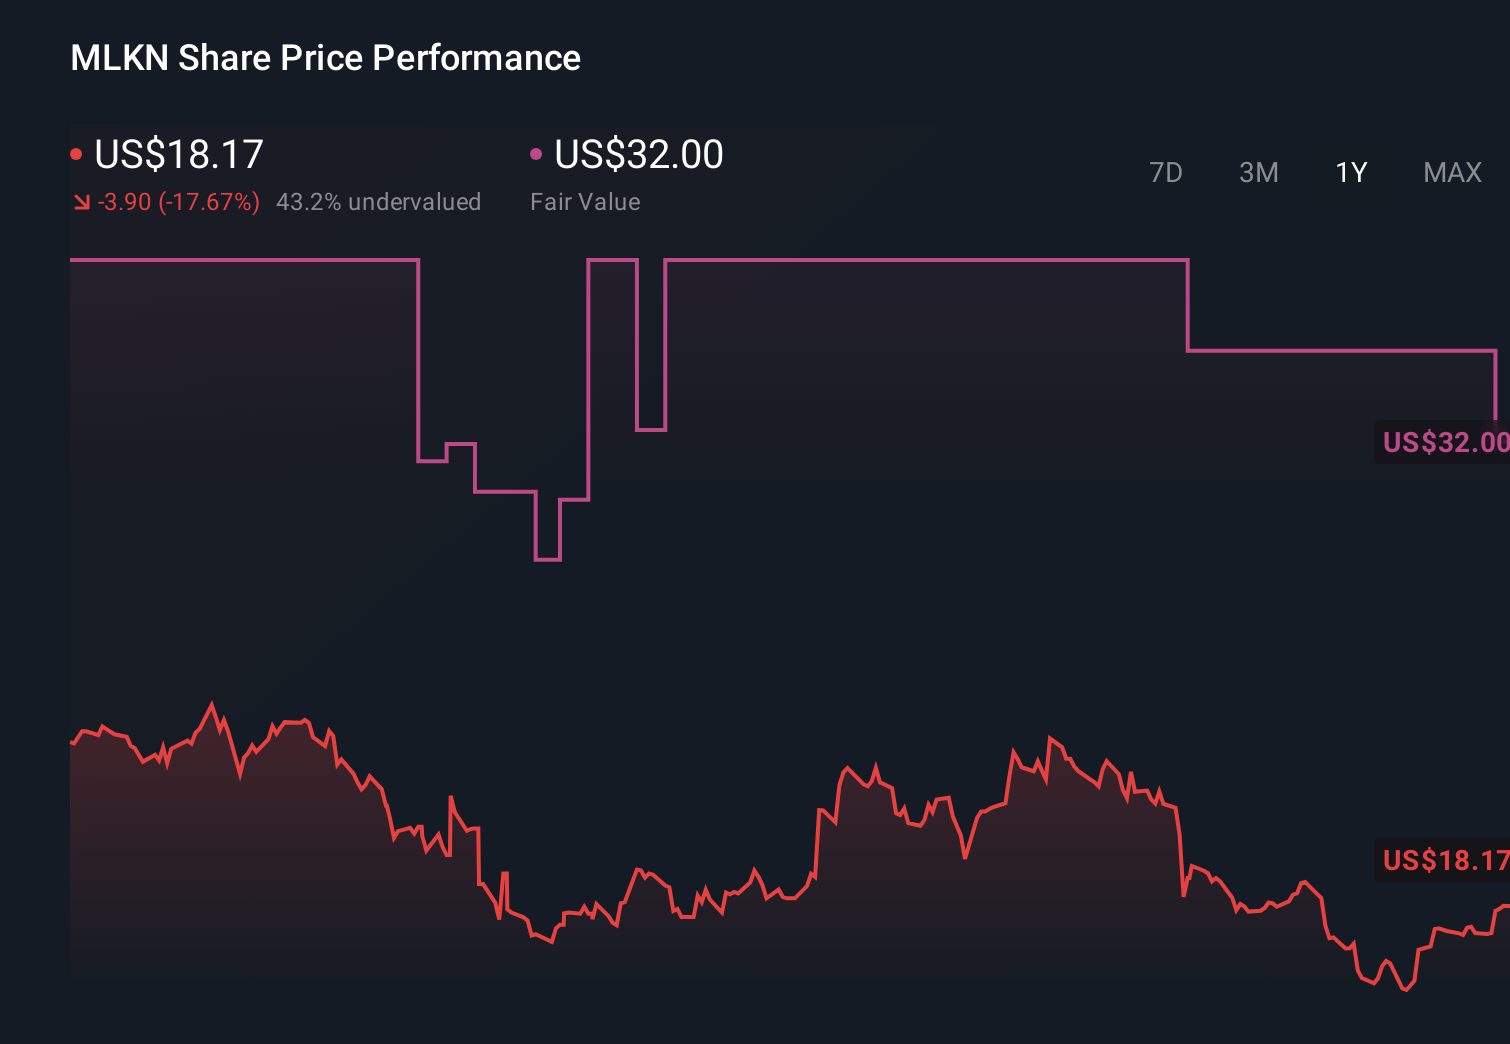
- The stock has shown a mixed pattern, with a 13.2% return over the last 30 days and 19.3% year to date, but a 3.4% decline over the past week and a 32.0% decline over five years that some investors may still have in mind.
- Recent coverage has focused on how MillerKnoll fits into the commercial services and office furnishings space, as investors reassess how demand for workplace and home office products is evolving. This context helps explain why shorter term returns such as the 30 day and year to date figures look different from the much longer term 5 year return.
- On our checklist based valuation framework, MillerKnoll currently scores 5 out of 6. This raises useful questions about what each method is capturing and how you can go one step further by considering a more holistic approach, which we will come to at the end of this article.
Approach 1: MillerKnoll Discounted Cash Flow (DCF) Analysis
A Discounted Cash Flow, or DCF, model estimates what a company could be worth today by projecting its future cash flows and then discounting those back to a present value. It is essentially asking what those future dollars are worth in your hand right now.
For MillerKnoll, the model used is a 2 Stage Free Cash Flow to Equity approach, based on cash flow projections rather than earnings. The latest twelve month free cash flow is about $109.3 million. Looking ahead, analysts and extrapolations in this model point to projected free cash flow of $584.7 million in 2035, with intermediate steps such as $130.7 million in 2026 and $254.5 million in 2028. All of these are in $ and stay below the 1b mark, so they are in the hundreds of millions rather than billions.
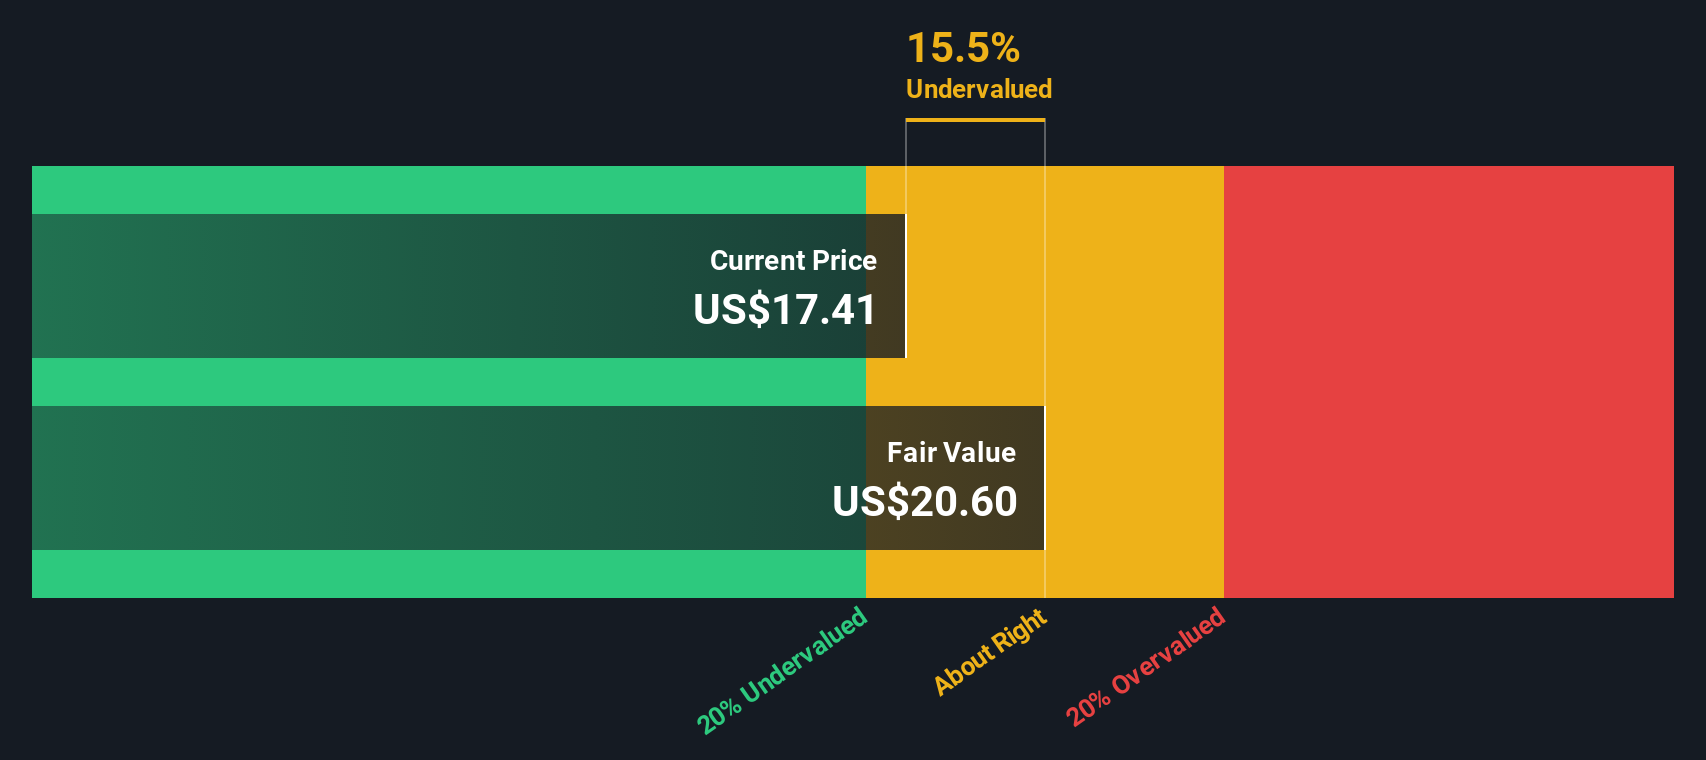
When all of those projected cash flows are discounted back, the model arrives at an estimated intrinsic value of $101.33 per share. Compared to the recent share price of around $21.78, the DCF output suggests the stock is trading at a significant discount, with an implied difference of 78.5%.
Result: UNDERVALUED (model output)
Our Discounted Cash Flow (DCF) analysis suggests MillerKnoll is undervalued by 78.5%. Track this in your watchlist or portfolio, or discover 53 more high quality undervalued stocks.
Approach 2: MillerKnoll Price vs Sales
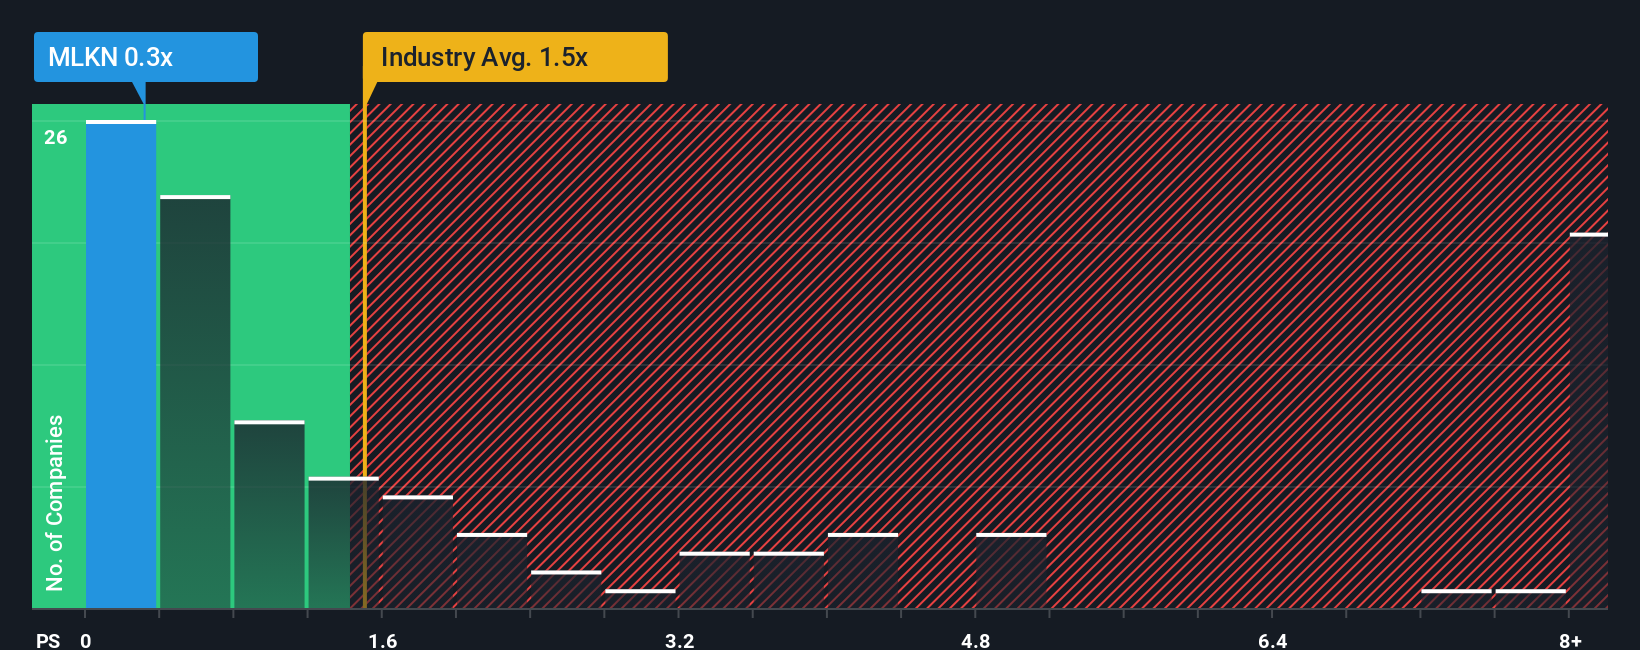
For MillerKnoll, the preferred yardstick is the P/S ratio, which can be useful when you want to compare what investors are paying for each dollar of revenue, especially when earnings are not a clean guide.
In simple terms, a higher multiple usually reflects higher growth expectations or lower perceived risk, while a lower multiple tends to be associated with more muted growth expectations or higher perceived risk. That is why a “normal” or “fair” P/S ratio is rarely one size fits all.
MillerKnoll currently trades on a P/S of 0.40x, compared with the Commercial Services industry average of 1.27x and a peer average of 0.97x. Simply Wall St’s Fair Ratio for MillerKnoll is 1.15x, which is an internally calculated P/S level that reflects factors such as earnings growth, industry, profit margins, market cap and specific risks.
The Fair Ratio can be more informative than a simple comparison with peers or the broad industry, because it tries to tailor the “expected” multiple to the company’s own profile rather than assuming that all firms deserve the same benchmark.
Against that Fair Ratio of 1.15x, the current P/S of 0.40x suggests MillerKnoll screens as undervalued on this metric.
Result: UNDERVALUED
P/S ratios tell one story, but what if the real opportunity lies elsewhere? Start investing in legacies, not executives. Discover our 23 top founder-led companies.
Upgrade Your Decision Making: Choose your MillerKnoll Narrative
Earlier we mentioned that there is an even better way to understand valuation. On Simply Wall St you can build or follow a MillerKnoll Narrative, which is essentially your story about the company tied directly to numbers like your assumed fair value, revenue, earnings and margin forecasts. These are then compared with the current price to help you decide whether to act, all within an easy Community page tool that automatically refreshes when new earnings or news arrives. For example, one investor might back a higher US$38.00 fair value based on expectations for revenue of US$4.0b, earnings of US$293.0m and a future P/E of 10.8x, while another might anchor closer to the US$32.00 fair value update with a 4.46% revenue growth rate, a 12.70% margin and a 5.25x P/E. Both can clearly see how their different stories lead to different fair values for the same MillerKnoll share price of about US$20.49.
Do you think there's more to the story for MillerKnoll? Head over to our Community to see what others are saying!
This article by Simply Wall St is general in nature. We provide commentary based on historical data and analyst forecasts only using an unbiased methodology and our articles are not intended to be financial advice. It does not constitute a recommendation to buy or sell any stock, and does not take account of your objectives, or your financial situation. We aim to bring you long-term focused analysis driven by fundamental data. Note that our analysis may not factor in the latest price-sensitive company announcements or qualitative material. Simply Wall St has no position in any stocks mentioned.