Is It Too Late To Consider Newmark Group (NMRK) After Its Strong Recent Share Price Run?
Newmark Group, Inc. Class A NMRK | 0.00 |
- Investors may be wondering if Newmark Group at around US$16.60 is still offering value after a strong run, or if most of the upside is already reflected in the price.
- The stock has returned 5.3% over the past week and 13.2% over the past month, while the 1 year return sits at 49.7% and the 3 year return is a very large multiple, with a 5 year return of 36.3%. This means recent moves come on top of a sizeable longer term track record.
- Recent coverage around Newmark Group has focused on its position within the US real estate management and development space and how investors are weighing sector specific risks against individual company fundamentals. This context is important because sentiment toward the sector can influence how investors treat any valuation gaps in a stock like Newmark Group.
- Newmark Group currently has a valuation score of 5 out of 6. The rest of this article will walk through what that means across different valuation methods and then finish with a more holistic way to think about value beyond a single score.
Approach 1: Newmark Group Discounted Cash Flow (DCF) Analysis
A Discounted Cash Flow model takes estimates of the cash a company could generate in the future and discounts those cash flows back to today, aiming to give a single estimate of what the business might be worth now.
For Newmark Group, the model used is a 2 Stage Free Cash Flow to Equity approach. The company’s latest twelve month free cash flow is about $126 million. Analyst estimates and subsequent extrapolations by Simply Wall St project free cash flow reaching $581 million by 2030, with a path that includes projected figures such as $463 million in 2026 and $536 million in 2029.
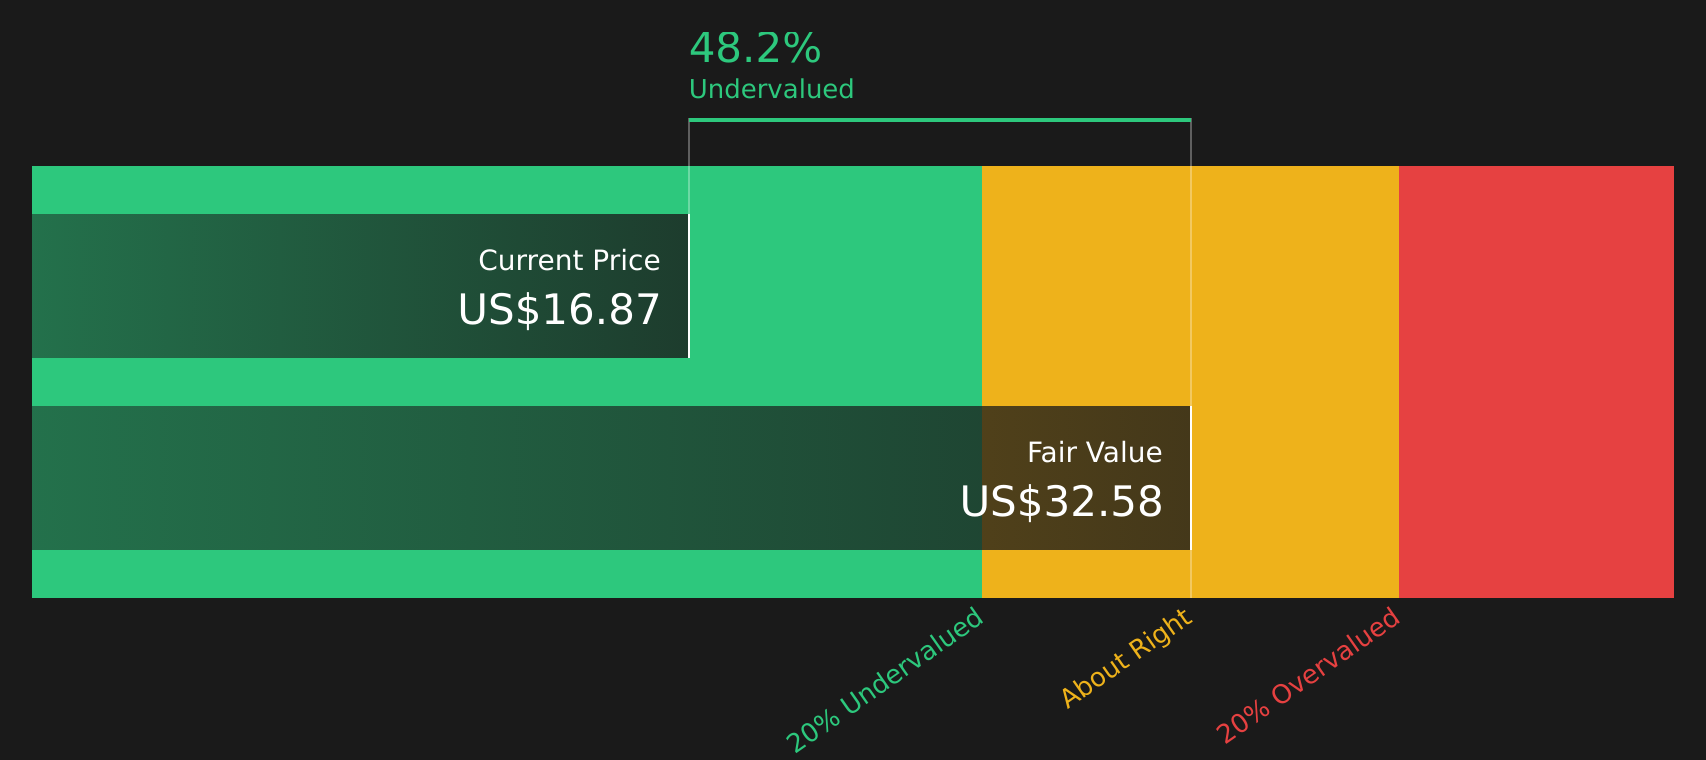
When all these projected cash flows are discounted back using this model, the estimated intrinsic value comes out at about $33.79 per share. Compared with the recent share price of around $16.60, the model implies a discount of roughly 50.9%, which indicates that Newmark Group stock is trading materially below this DCF estimate according to this approach.
Result: UNDERVALUED
Our Discounted Cash Flow (DCF) analysis suggests Newmark Group is undervalued by 50.9%. Track this in your watchlist or portfolio, or discover 44 more high quality undervalued stocks.
Approach 2: Newmark Group Price vs Earnings
For a profitable company, the P/E ratio is a straightforward way to think about what you are paying for each dollar of earnings, which makes it a useful cross check against the DCF result you just saw.
In general, higher growth expectations and lower perceived risk can support a higher P/E ratio, while slower growth and higher risk tend to justify a lower one. So the question is not whether a P/E is high or low in isolation, but whether it makes sense given the company’s specific profile.
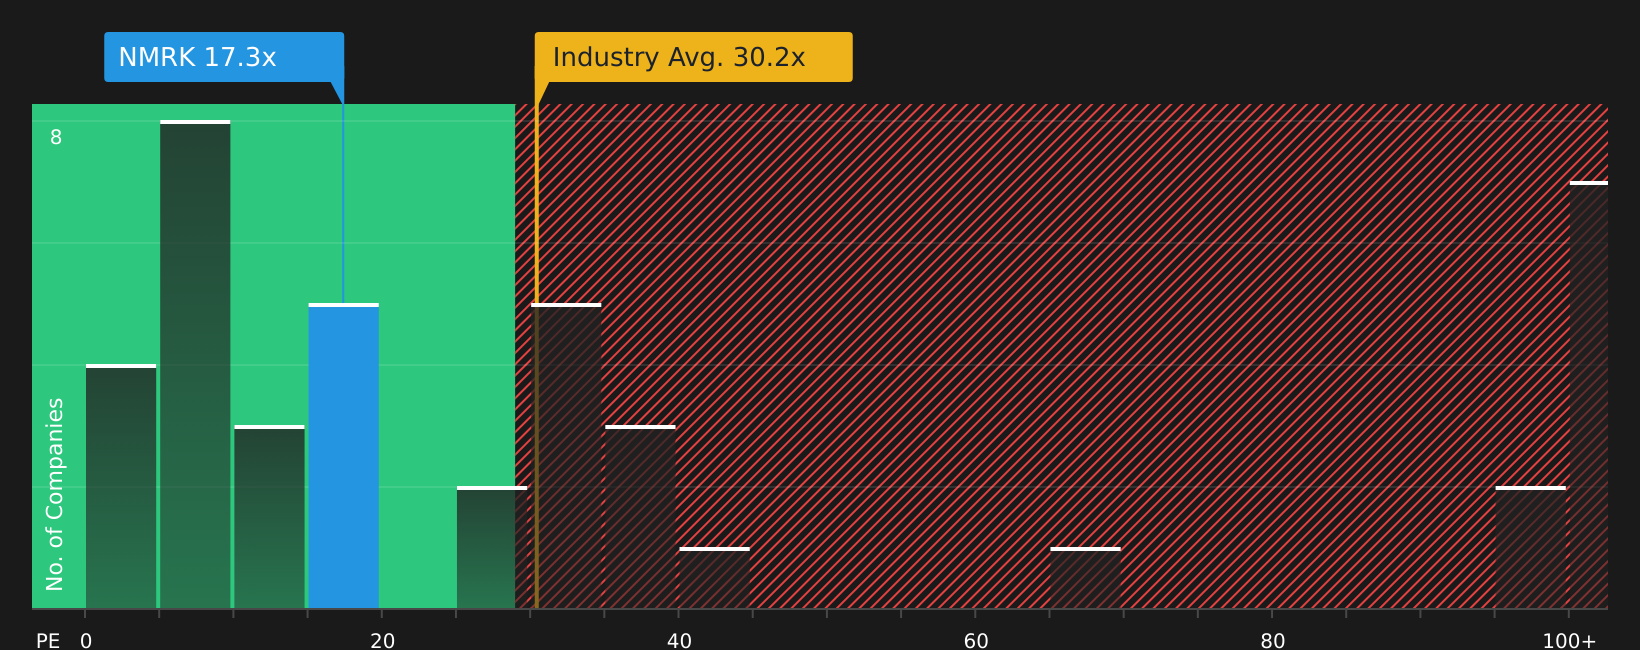
Newmark Group’s current P/E is 24.26x. That sits below the broader Real Estate industry average of 29.13x and also below the peer group average of 34.28x, so the stock trades at a discount on a simple comparison.
Simply Wall St’s Fair Ratio for Newmark Group is 26.12x. This is a proprietary estimate of what a reasonable P/E could be, given factors such as earnings growth, industry, profit margins, market cap and risk. Because it blends these company specific inputs, the Fair Ratio can be a more tailored guide than broad peer or industry averages.
Comparing the Fair Ratio of 26.12x with the actual P/E of 24.26x suggests Newmark Group trades below this tailored reference point, which points to the stock looking undervalued on this measure.
Result: UNDERVALUED
P/E ratios tell one story, but what if the real opportunity lies elsewhere? Start investing in legacies, not executives. Discover our 19 top founder-led companies.
Upgrade Your Decision Making: Choose your Newmark Group Narrative
Earlier it was mentioned that there is an even better way to understand valuation. This is where Narratives come in, letting you attach a clear story about Newmark Group to numbers like your own fair value, revenue, earnings and margin assumptions, then linking that story to a forecast and a fair value that you can easily compare with the current share price.
On Simply Wall St's Community page, Narratives are available as an accessible tool used by millions of investors. You can see different views on Newmark Group side by side, such as a more cautious Narrative that points to a Fair Value of US$18.50 and a more optimistic Narrative that points to a Fair Value of US$21.00, and decide which story best matches your expectations.
Narratives help you turn that choice into action by showing how your preferred Fair Value compares to the latest price so you can decide whether the gap is large enough for you to consider buying or selling. They update continuously as new data, news or earnings are added, so your view on Newmark Group is based on the latest available information.
Do you think there's more to the story for Newmark Group? Head over to our Community to see what others are saying!

This article by Simply Wall St is general in nature. We provide commentary based on historical data and analyst forecasts only using an unbiased methodology and our articles are not intended to be financial advice. It does not constitute a recommendation to buy or sell any stock, and does not take account of your objectives, or your financial situation. We aim to bring you long-term focused analysis driven by fundamental data. Note that our analysis may not factor in the latest price-sensitive company announcements or qualitative material. Simply Wall St has no position in any stocks mentioned.