

Is It Too Late To Consider Nucor (NUE) After Its 132% One-Year Rally?
Nucor Corporation NUE | 0.00 |
- If you are wondering whether Nucor stock still offers value at current levels, the key is understanding what the recent share price is actually pricing in.
- The stock last closed at US$250.00, with returns of 7.8% over 7 days, 12.4% over 30 days, 47.6% year to date and 132.1% over 1 year. This naturally raises questions about how much upside or downside may be left.
- Recent coverage of Nucor has focused on its position within the broader materials sector and how investor sentiment around steel demand and capital spending is influencing trading activity. Taken together, these headlines help explain why the stock's recent performance has been closely watched by both new and existing shareholders.
- Nucor currently has a valuation score of 3/6. The rest of this article will break down what that means using different valuation approaches, before finishing with a more holistic way to think about whether the stock suits your portfolio.
Approach 1: Nucor Discounted Cash Flow (DCF) Analysis
A Discounted Cash Flow, or DCF, model estimates what a stock could be worth today by projecting future cash flows and discounting them back to their present value. It is essentially asking what the future stream of cash to shareholders is worth in today’s dollars.
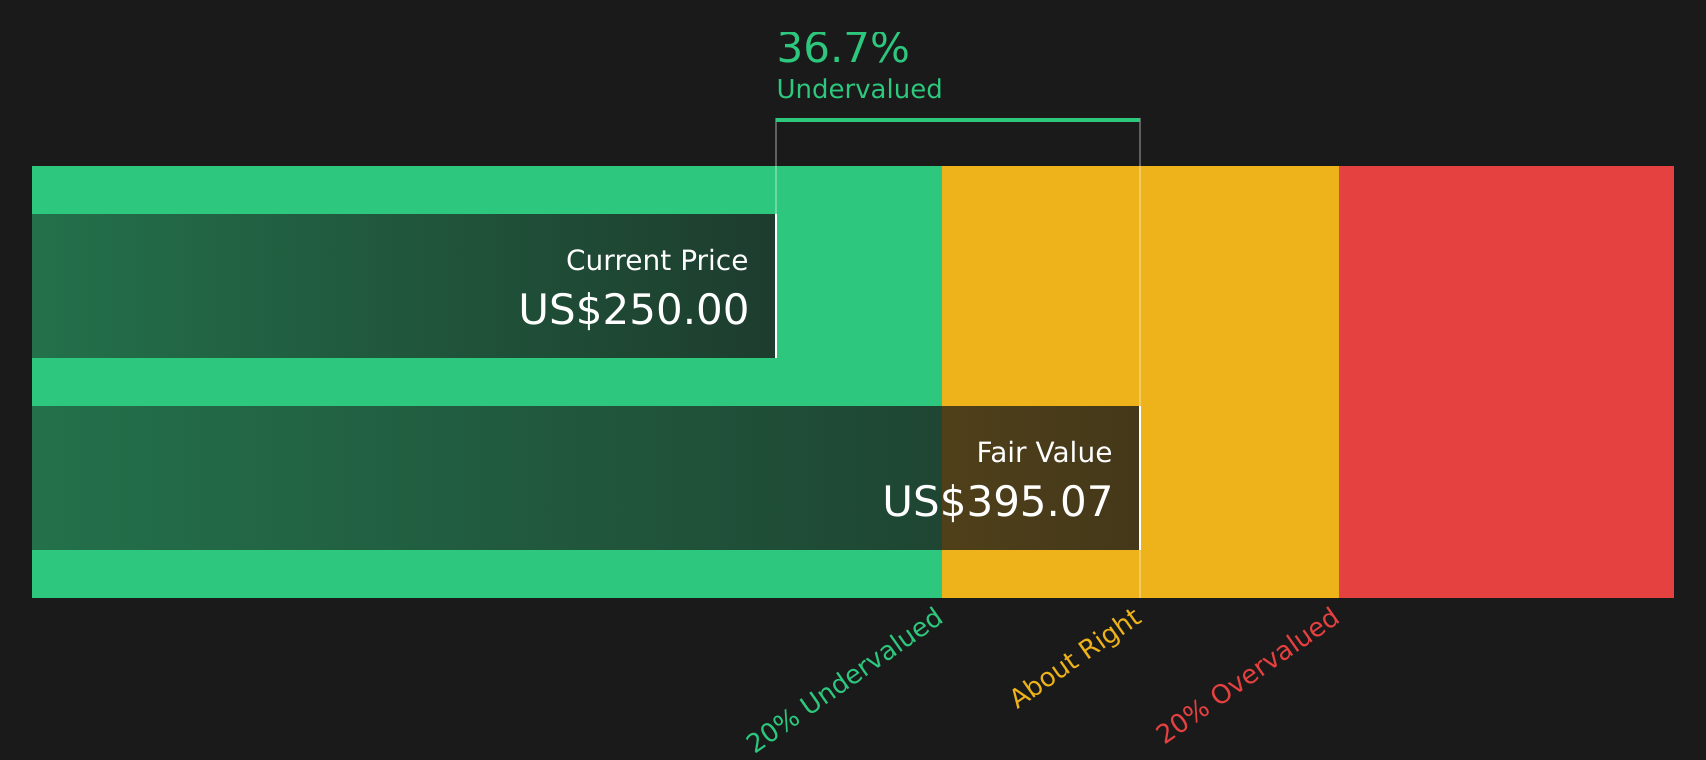
For Nucor, the model used is a 2 Stage Free Cash Flow to Equity approach, based on cash flow projections in US$. The latest twelve month free cash flow is about $656.4 million. Analyst estimates and subsequent extrapolations in this model project free cash flow rising to $5.8b by 2030, with annual projections between 2026 and 2035 ranging from about $2.6b to $6.8b before discounting.
When these forecast cash flows are discounted back, this DCF model arrives at an estimated intrinsic value of $395.22 per share. Compared with the recent share price of $250.00, this specific model outcome implies the stock is 36.7% undervalued on this set of cash flow assumptions.
Result: UNDERVALUED
Our Discounted Cash Flow (DCF) analysis suggests Nucor is undervalued by 36.7%. Track this in your watchlist or portfolio, or discover 46 more high quality undervalued stocks.
Approach 2: Nucor Price vs Earnings
For profitable companies, the P/E ratio is a useful shortcut because it links what you are paying directly to the earnings the business is already generating. It helps you see how many dollars of price you pay for each dollar of current earnings.
What counts as a “normal” P/E depends on how fast earnings are expected to grow and how risky those earnings are. Higher expected growth or lower perceived risk can justify a higher P/E, while slower growth or higher risk usually supports a lower one.
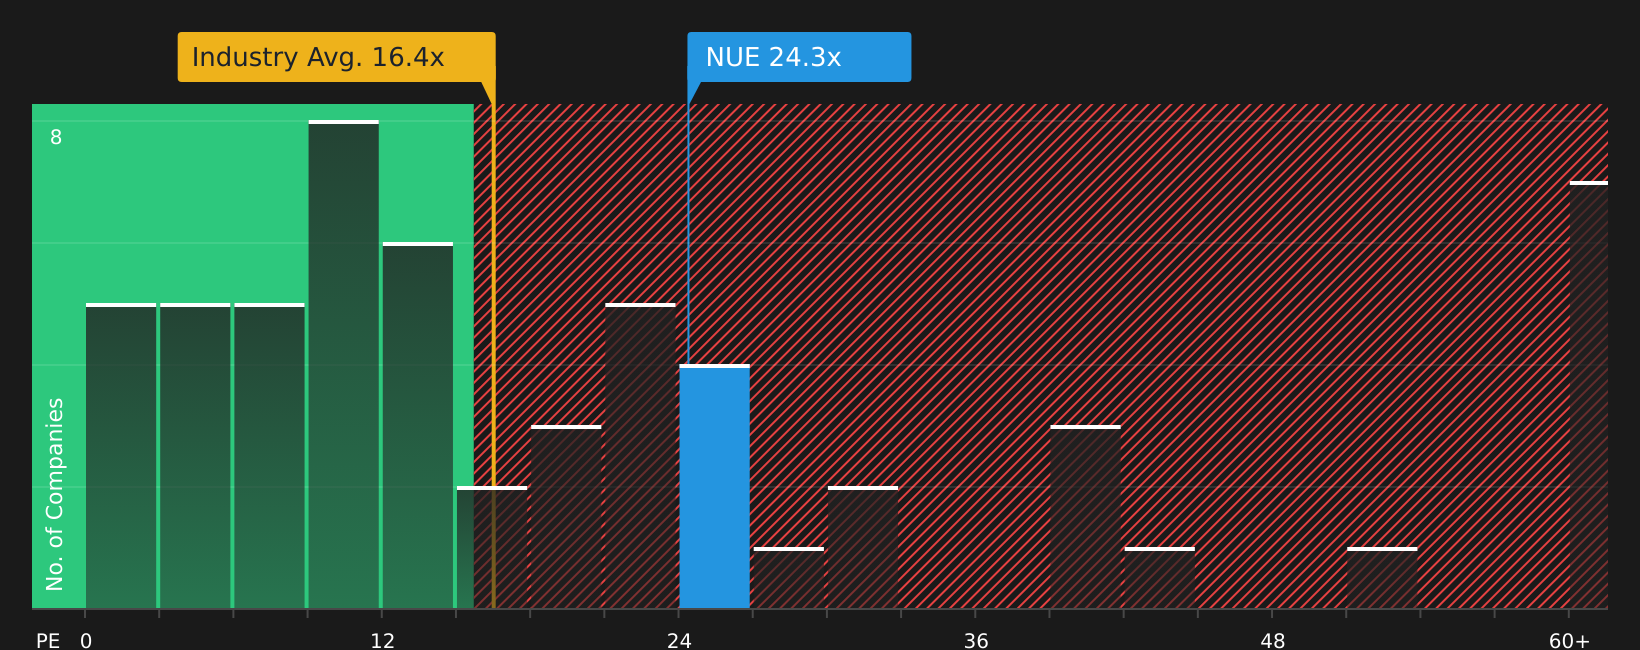
Nucor currently trades on a P/E of 24.5x. This sits above the Metals and Mining industry average of about 19.4x and the peer average of 21.2x. Simply Wall St’s Fair Ratio for Nucor is 28.3x. This Fair Ratio is a proprietary estimate of what Nucor’s P/E might be given its earnings growth, industry, profit margins, market cap and risk profile.
Because the Fair Ratio incorporates company specific fundamentals instead of just comparing with broad industry or peer averages, it can be more tailored to Nucor’s situation. With the current P/E of 24.5x below the Fair Ratio of 28.3x, this approach indicates that the stock may be undervalued on earnings.
Result: UNDERVALUED
P/E ratios tell one story, but what if the real opportunity lies elsewhere? Start investing in legacies, not executives. Discover our 21 top founder-led companies.
Upgrade Your Decision Making: Choose your Nucor Narrative
Earlier it was mentioned that there is an even better way to understand valuation, so Narratives on Simply Wall St take the story you believe about Nucor, connect it to specific assumptions for future revenue, earnings and margins, turn that into a Fair Value, then continuously update that view when new news or earnings arrive. This allows you to compare Fair Value with the current price and decide whether the stock still fits your plan, whether you think Nucor looks closer to the cautious case around a Fair Value of about US$175 with revenue of US$38.1b, earnings of US$3.4b and a P/E of 14.7x by 2029, or nearer the optimistic case around a Fair Value of US$250 with revenue of US$40.6b, earnings of US$4.0b and a P/E of 17.8x. All of this is presented within an accessible Community page that is already used by millions of investors.
Do you think there's more to the story for Nucor? Head over to our Community to see what others are saying!

This article by Simply Wall St is general in nature. We provide commentary based on historical data and analyst forecasts only using an unbiased methodology and our articles are not intended to be financial advice. It does not constitute a recommendation to buy or sell any stock, and does not take account of your objectives, or your financial situation. We aim to bring you long-term focused analysis driven by fundamental data. Note that our analysis may not factor in the latest price-sensitive company announcements or qualitative material. Simply Wall St has no position in any stocks mentioned.