

Is It Too Late To Consider NXP Semiconductors (NXPI) After A 31% One-Year Rally?
NXP Semiconductors NV NXPI | 0.00 |
- If you are wondering whether NXP Semiconductors at around US$224.50 is priced attractively or asking too much, the valuation picture is the key place to focus.
- The stock has recorded returns of 7.0% over the last 7 days, 17.3% over 30 days, 1.5% year to date, and 31.0% over the past year, which naturally raises questions about what is already reflected in the share price.
- Recent coverage has centered on NXP Semiconductors as part of broader conversations about semiconductor names and their role in long term technology trends, giving investors extra context for these returns. At the same time, the stock continues to feature in ongoing valuation discussions that compare it to peers on metrics like earnings and cash flow.
- On Simply Wall St's valuation checks, NXP Semiconductors currently scores 3 out of 6. The rest of this article will break down what different valuation methods say about that score and point to an even richer way of thinking about value at the end.
Approach 1: NXP Semiconductors Discounted Cash Flow (DCF) Analysis
A Discounted Cash Flow, or DCF, model estimates what a business might be worth by projecting its future cash flows and then discounting those back to today using a required rate of return.
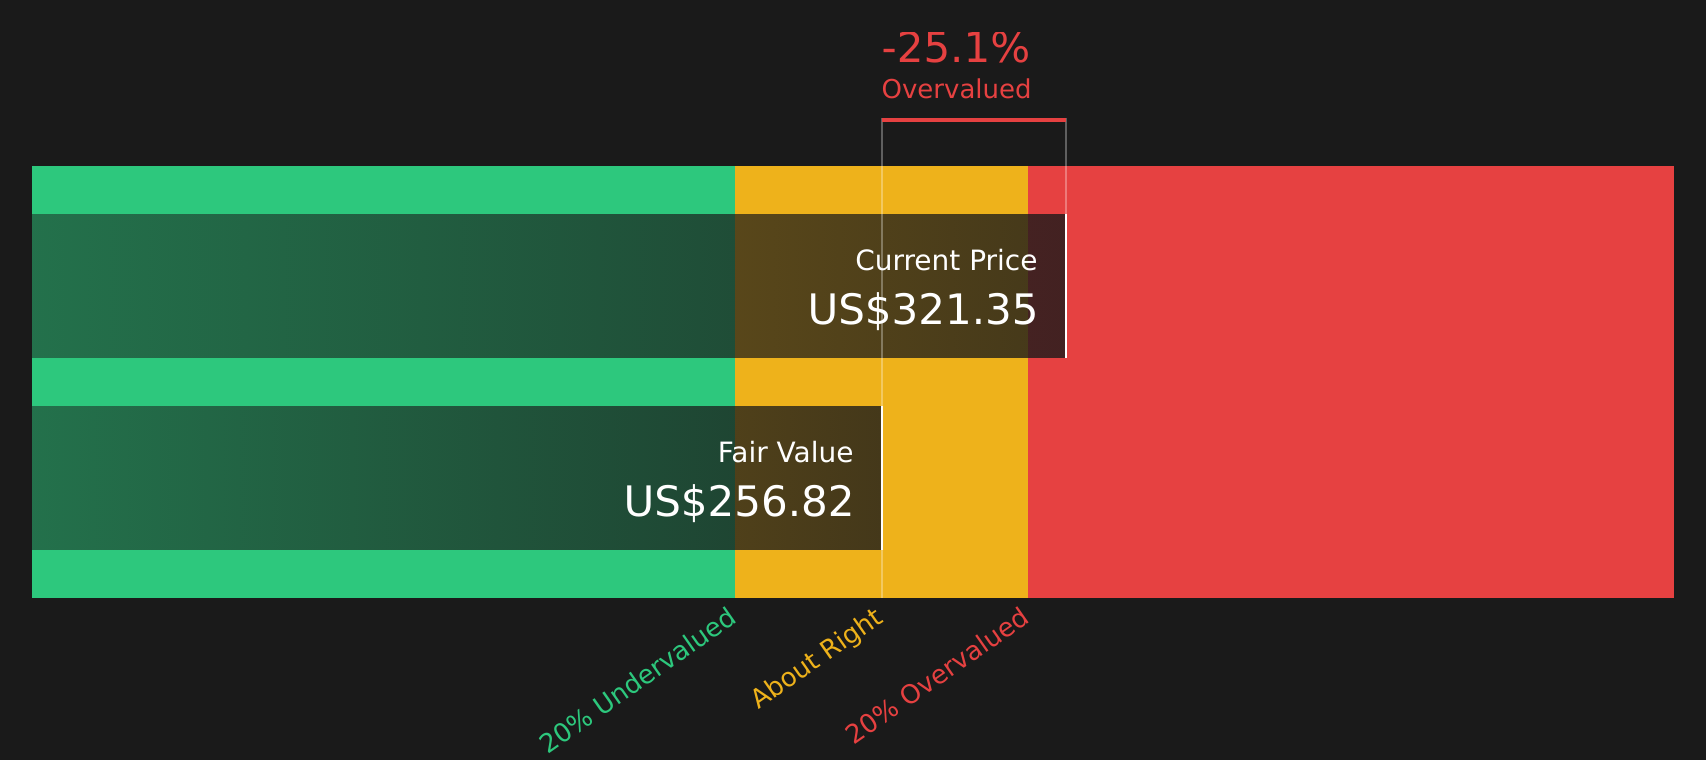
For NXP Semiconductors, Simply Wall St applies a 2 Stage Free Cash Flow to Equity model using Free Cash Flow in $ as the starting point. The latest twelve month Free Cash Flow is about $2.0b. Analyst inputs and extrapolations then build out a path where projected Free Cash Flow reaches about $4.9b by 2030, with interim years such as 2026 and 2027 modeled at $3.4b and $3.7b respectively. Beyond the explicit analyst horizon, the platform extrapolates further annual figures to 2035 based on its own assumptions.
After discounting these projected cash flows back to today, the model arrives at an estimated intrinsic value of about $232.28 per share. Against a recent share price around $224.50, this implies a 3.3% discount, which suggests NXP Semiconductors is trading very close to the DCF estimate of fair value.
Result: ABOUT RIGHT
NXP Semiconductors is fairly valued according to our Discounted Cash Flow (DCF), but this can change at a moment's notice. Track the value in your watchlist or portfolio and be alerted on when to act.
Approach 2: NXP Semiconductors Price vs Earnings
For profitable companies, the P/E ratio is a useful quick check because it links what you pay per share to the earnings that each share generates. In general, higher growth expectations and lower perceived risk can justify a higher P/E, while slower expected growth or higher risk usually call for a lower, more conservative multiple.
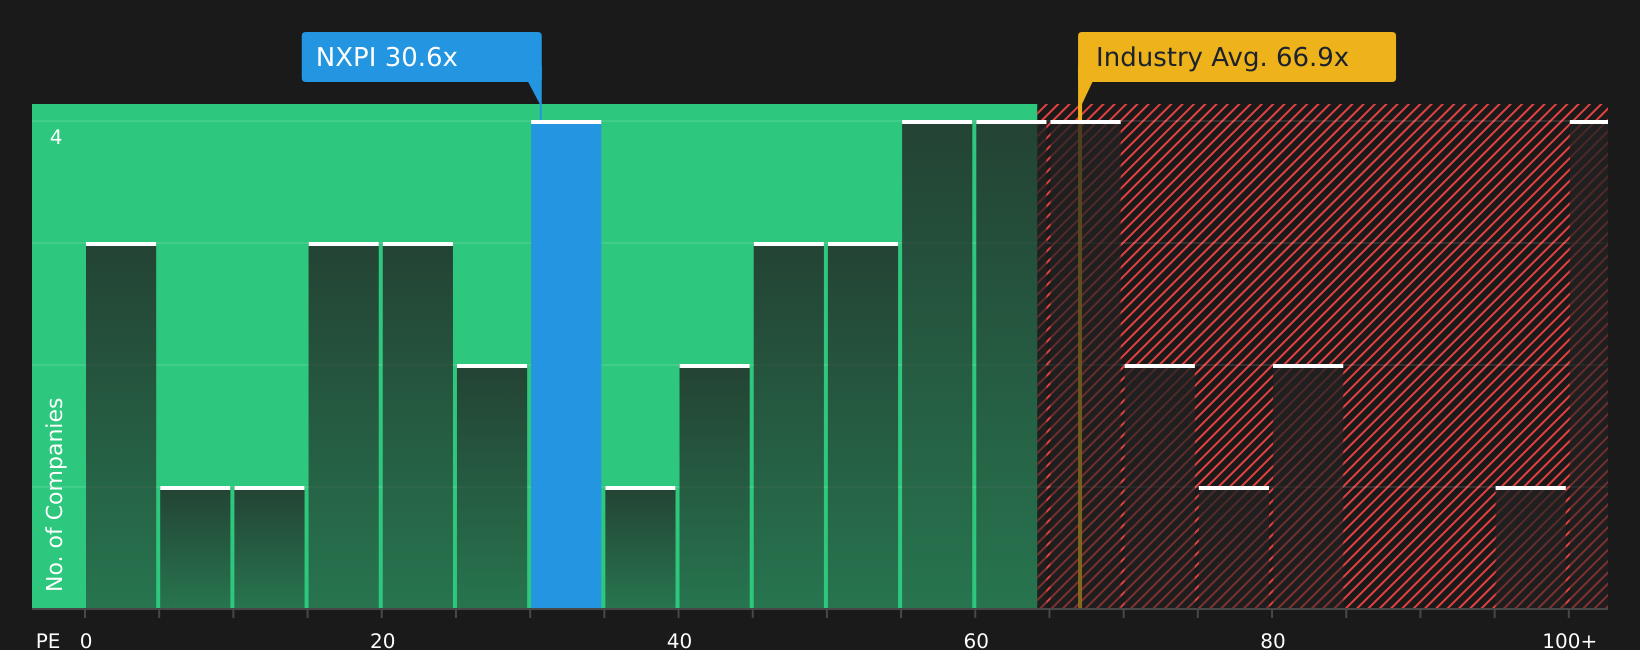
NXP Semiconductors currently trades on a P/E of about 28.1x. That sits below the Semiconductor industry average of around 47.2x and also below the peer average of about 73.9x that Simply Wall St uses for comparison. By itself, that gap does not automatically make the stock cheap or expensive. It just shows the market is applying a lower earnings multiple than many peers.
To get a more tailored view, Simply Wall St uses a proprietary “Fair Ratio”, which estimates what a more appropriate P/E might be after factoring in elements such as earnings growth, profit margins, industry, market cap and specific risks. For NXP Semiconductors, this Fair Ratio is 27.4x, very close to the current 28.1x P/E. That suggests the share price is roughly in line with what this model would expect.
Result: ABOUT RIGHT
P/E ratios tell one story, but what if the real opportunity lies elsewhere? Start investing in legacies, not executives. Discover our 19 top founder-led companies.
Upgrade Your Decision Making: Choose your NXP Semiconductors Narrative
Earlier it was mentioned that there is an even better way to understand valuation. Meet Narratives, a simple tool on Simply Wall St's Community page that lets you spell out your story for NXP Semiconductors, link it to your own forecast for revenue, earnings and margins, and see the Fair Value that results. You can then compare that to the live share price to help decide whether to buy, hold or sell, with the whole view updating as new earnings or news arrives so your thesis never sits stale.
For NXP Semiconductors, one investor might lean toward an optimistic Narrative that ties edge AI products, automotive content growth and a Fair Value around US$305.82 into a case for stronger long term earnings. Another might focus on auto cycle risk, tariff pressure and an emphasis on a lower Fair Value near US$174.04. Narratives lets you see both stories, the numbers behind them and where your own view fits in between.
For NXP Semiconductors, here are previews of two leading NXP Semiconductors Narratives to make comparison easier:
Fair value: US$260.84 per share
Gap to current price: about 13.9% below this fair value estimate
Assumed revenue growth rate: 9.1% a year
- Analysts framing this view expect automotive inventory normalization, auto semiconductor demand and industrial and IoT recovery to support higher revenue and margin outcomes over time.
- They factor in cost discipline, portfolio optimization and acquisitions aimed at auto and edge AI as helpful for earnings power, while using an 11.1% discount rate and a P/E of 23.3x on projected 2029 earnings.
- This camp also highlights risks such as modest demand recovery, competition in China, acquisition integration and higher operating costs, and encourages you to test those inputs against your own expectations.
Fair value: US$219.05 per share
Gap to current price: about 2.5% above this fair value estimate
Assumed revenue growth rate: 7.9% a year
- The more cautious view leans on factors such as weaker auto demand, macro and tariff uncertainty, and pressure in mobile and communication segments, combined with the added question mark of a CEO transition.
- Bearish analysts in this camp work with slower revenue growth, more modest margin improvement and a fair value that sits closer to the lower end of the published target range.
- They still see potential from acquisitions and edge AI, but treat these as slower burning contributors and focus more on the risk that revenue and margins land toward the lower end of expectations.
If you want to see how these stories are built from the bottom up and how other investors are framing the same facts, it is worth spending some time with the live Narratives on Simply Wall St. From there you can decide which set of assumptions feels closest to your own view of NXP Semiconductors.
Do you think there's more to the story for NXP Semiconductors? Head over to our Community to see what others are saying!

This article by Simply Wall St is general in nature. We provide commentary based on historical data and analyst forecasts only using an unbiased methodology and our articles are not intended to be financial advice. It does not constitute a recommendation to buy or sell any stock, and does not take account of your objectives, or your financial situation. We aim to bring you long-term focused analysis driven by fundamental data. Note that our analysis may not factor in the latest price-sensitive company announcements or qualitative material. Simply Wall St has no position in any stocks mentioned.