Is It Too Late To Consider Star Bulk Carriers (SBLK) After Strong Multi‑Year Returns?
Star Bulk Carriers Corp. SBLK | 24.32 | +2.83% |
- This article is for readers wondering whether Star Bulk Carriers still offers value at today’s price or whether most of the opportunity is already reflected in the share price, and is aimed at helping you frame that question clearly.
- The stock closed at US$19.64, with returns of 1.4% over 7 days, 0.9% over 30 days, 1.4% year to date and 31.0% over the past year, plus 16.3% over 3 years and 199.1% over 5 years. These figures can shape how investors think about both upside and risk today.
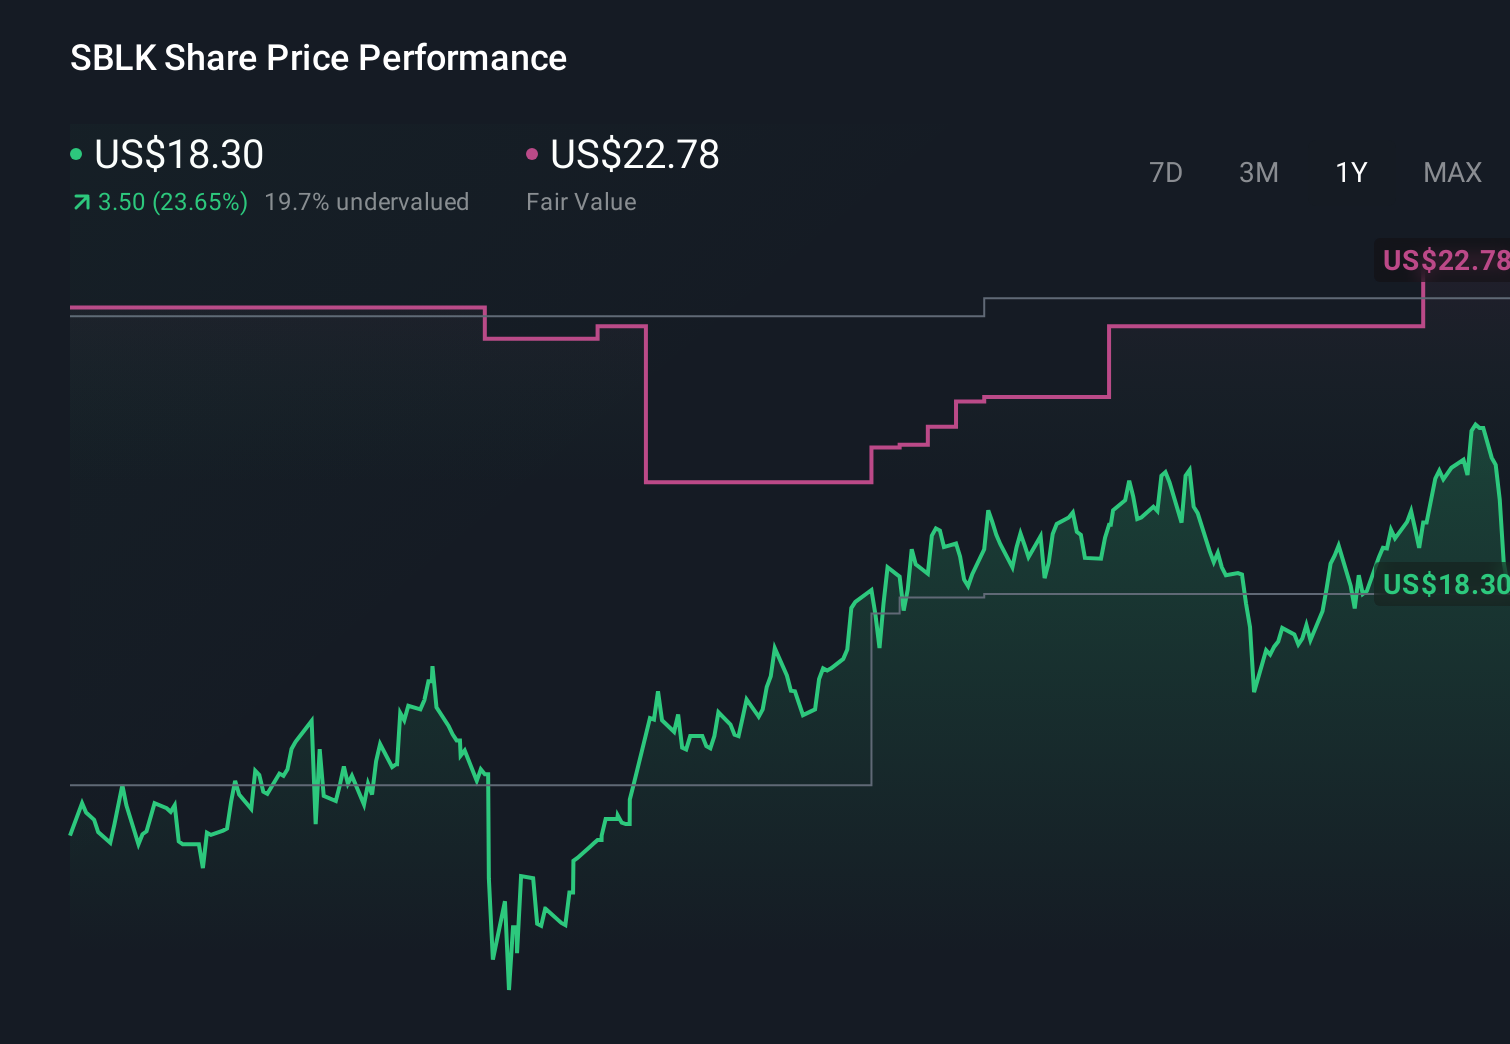
- Recent share price performance often ties back to factors like shipping rates, fleet deployment or broader sentiment toward dry bulk names, and Star Bulk Carriers is no exception. While this article is not tied to a specific one off catalyst, it aims to give context that remains useful even when short term headlines change.
- On Simply Wall St’s valuation checks, Star Bulk Carriers currently has a value score of 3 out of 6. We will look at what different valuation methods say about that number and then finish by discussing a broader way to think about the company’s value beyond any single model.
Approach 1: Star Bulk Carriers Discounted Cash Flow (DCF) Analysis
A Discounted Cash Flow, or DCF, model tries to estimate what a business is worth today by projecting its future cash flows and discounting them back to a present value. It is essentially asking what all the future cash that might be available to shareholders is worth in today’s dollars.
For Star Bulk Carriers, the model used is a 2 Stage Free Cash Flow to Equity approach. The latest twelve month free cash flow is reported at about $237.2 million. Simply Wall St then uses a mix of analyst inputs and its own extrapolations to project future free cash flow, with one data point of $622 million in 2027 and a series of ten year projections that gradually change over time based on the stated growth assumptions.
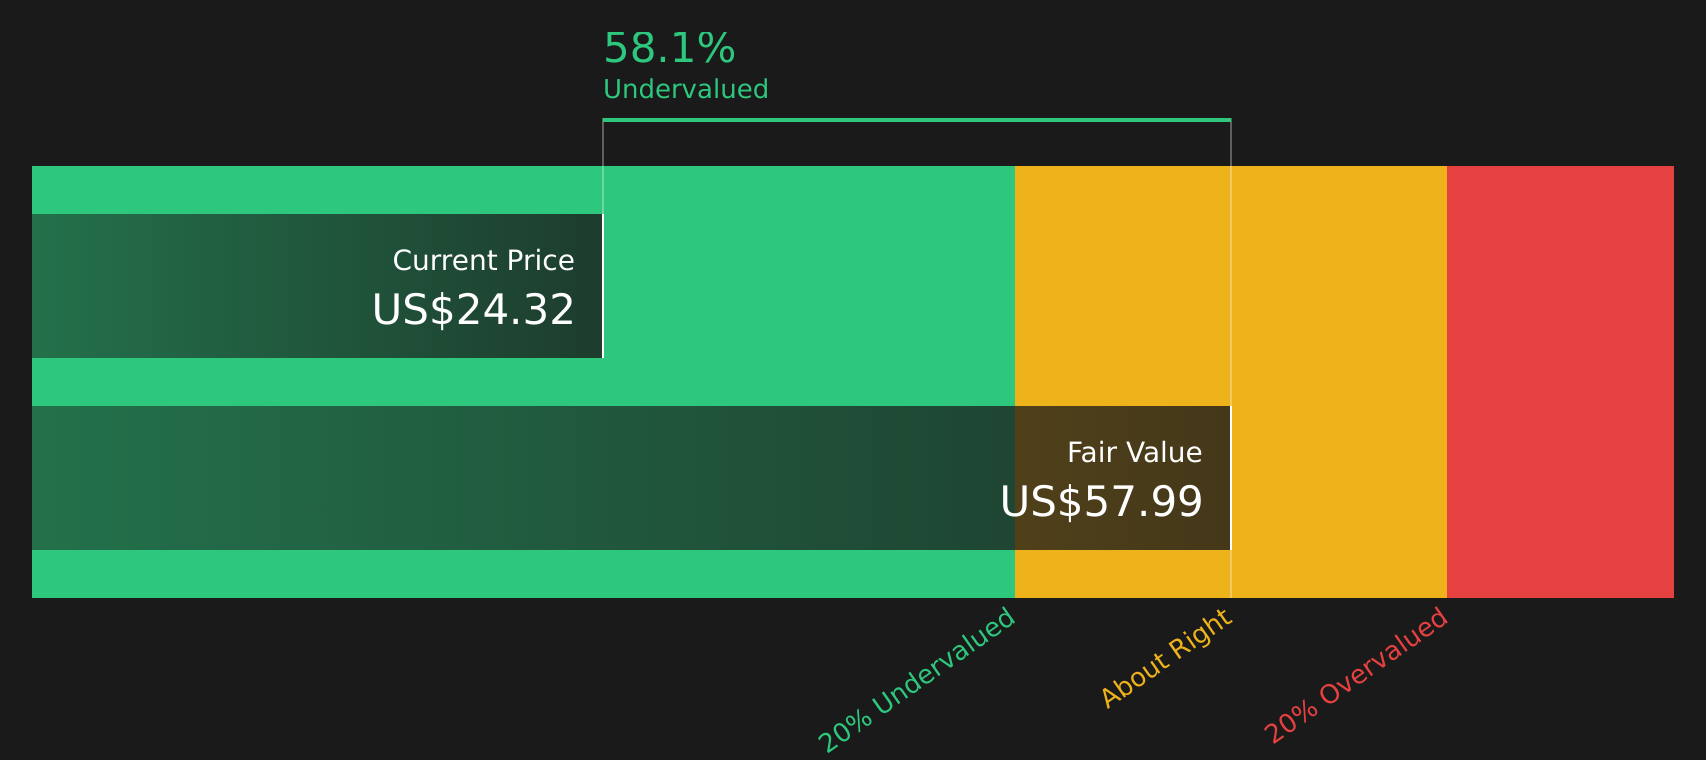
When those projected cash flows are discounted back, the model arrives at an estimated intrinsic value of $110.94 per share. Compared with the recent share price of $19.64, this implies the stock is 82.3% undervalued on this DCF view.
Result: UNDERVALUED
Our Discounted Cash Flow (DCF) analysis suggests Star Bulk Carriers is undervalued by 82.3%. Track this in your watchlist or portfolio, or discover 879 more undervalued stocks based on cash flows.
Approach 2: Star Bulk Carriers Price vs Earnings
For a profitable company, the P/E ratio is a straightforward way to relate what you pay for each share to the earnings that share currently represents. It gives you a quick sense of how many years of current earnings the market is pricing in.
What counts as a “normal” P/E depends on what investors expect from a company and how risky they think those earnings are. Higher expected growth or lower perceived risk can support a higher P/E, while lower expected growth or higher risk usually points to a lower multiple.
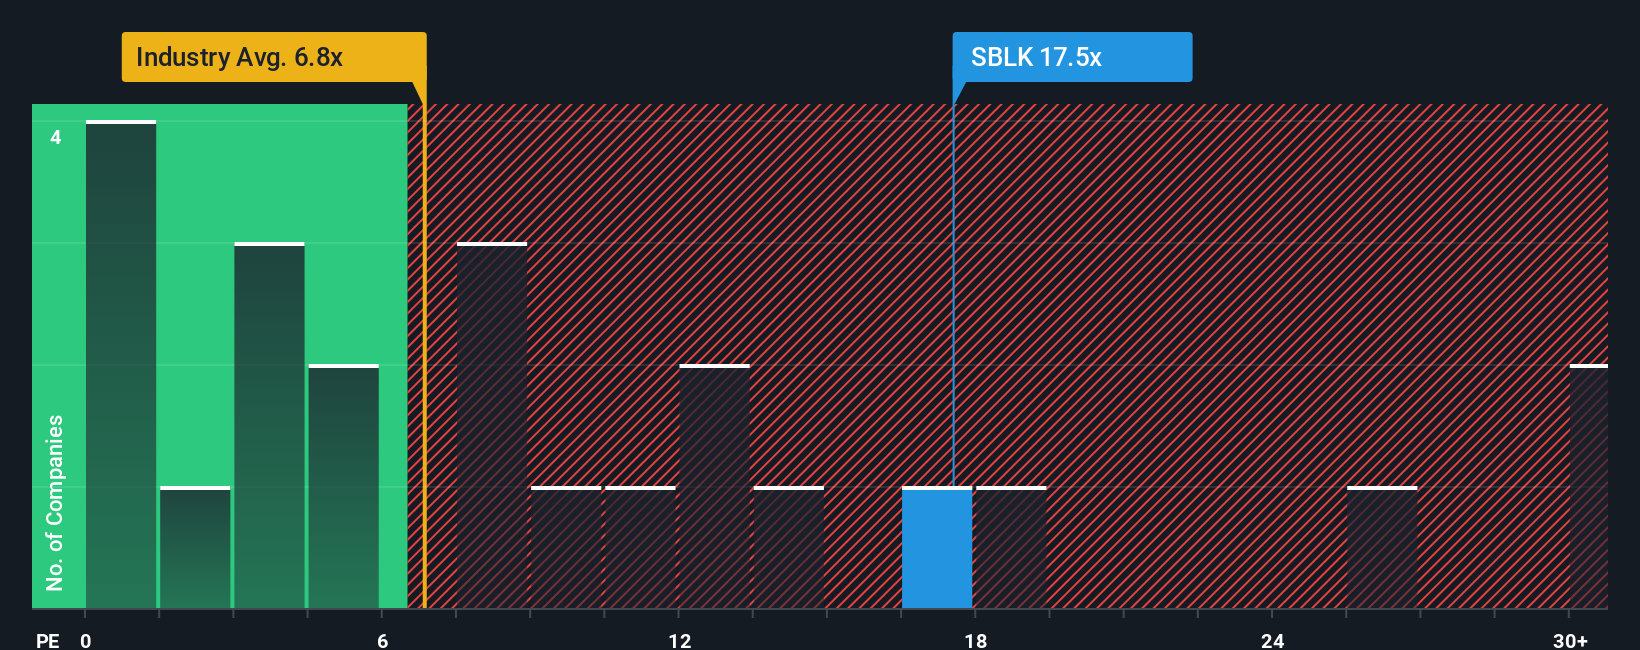
Star Bulk Carriers is trading on a P/E of 36.38x. That is above the Shipping industry average of 9.92x and also above the peer group average of 5.59x. Simply Wall St’s Fair Ratio for the company is 45.42x, which is its proprietary view of what the P/E might be given factors such as earnings characteristics, industry, profit margins, market cap and risk profile.
This Fair Ratio can be more tailored than a simple comparison with peers or the industry, because it tries to adjust for differences in growth, risk and profitability instead of assuming all Shipping companies should trade on the same multiple. With the current P/E of 36.38x sitting below the Fair Ratio of 45.42x, this framework indicates that the shares look relatively inexpensive on earnings.
Result: UNDERVALUED
P/E ratios tell one story, but what if the real opportunity lies elsewhere? Discover 1444 companies where insiders are betting big on explosive growth.
Upgrade Your Decision Making: Choose your Star Bulk Carriers Narrative
Earlier we mentioned that there is an even better way to understand valuation. Let us introduce Narratives, which are simply your story about Star Bulk Carriers, tied directly to a set of numbers such as your fair value, revenue, earnings and margin assumptions, and then compared with today’s share price to help you judge whether the stock looks attractive or expensive.
On Simply Wall St’s Community page, Narratives are an accessible tool that lets you link what you believe about the business to a financial forecast and a fair value in one place. They then update automatically when new information such as company news or earnings is added to the platform, so your view stays current without you needing to rebuild the whole thesis each time.
For Star Bulk Carriers, one investor might build a Narrative around tighter vessel supply, eco-upgrades and share repurchases, and decide that a fair value closer to the upper analyst target of US$24.00 makes sense. Another might focus on flat dry bulk trade, an aging fleet and high leverage, and anchor their fair value near the lower target of US$18.30. Seeing these different Narratives side by side can help you decide which story and fair value feels more realistic to you.
Do you think there's more to the story for Star Bulk Carriers? Head over to our Community to see what others are saying!
This article by Simply Wall St is general in nature. We provide commentary based on historical data and analyst forecasts only using an unbiased methodology and our articles are not intended to be financial advice. It does not constitute a recommendation to buy or sell any stock, and does not take account of your objectives, or your financial situation. We aim to bring you long-term focused analysis driven by fundamental data. Note that our analysis may not factor in the latest price-sensitive company announcements or qualitative material. Simply Wall St has no position in any stocks mentioned.