Is It Too Late To Consider Stifel Financial (SF) After Strong Multi‑Year Share Price Gains?
Stifel Financial Corp SF | 74.07 | +0.12% |
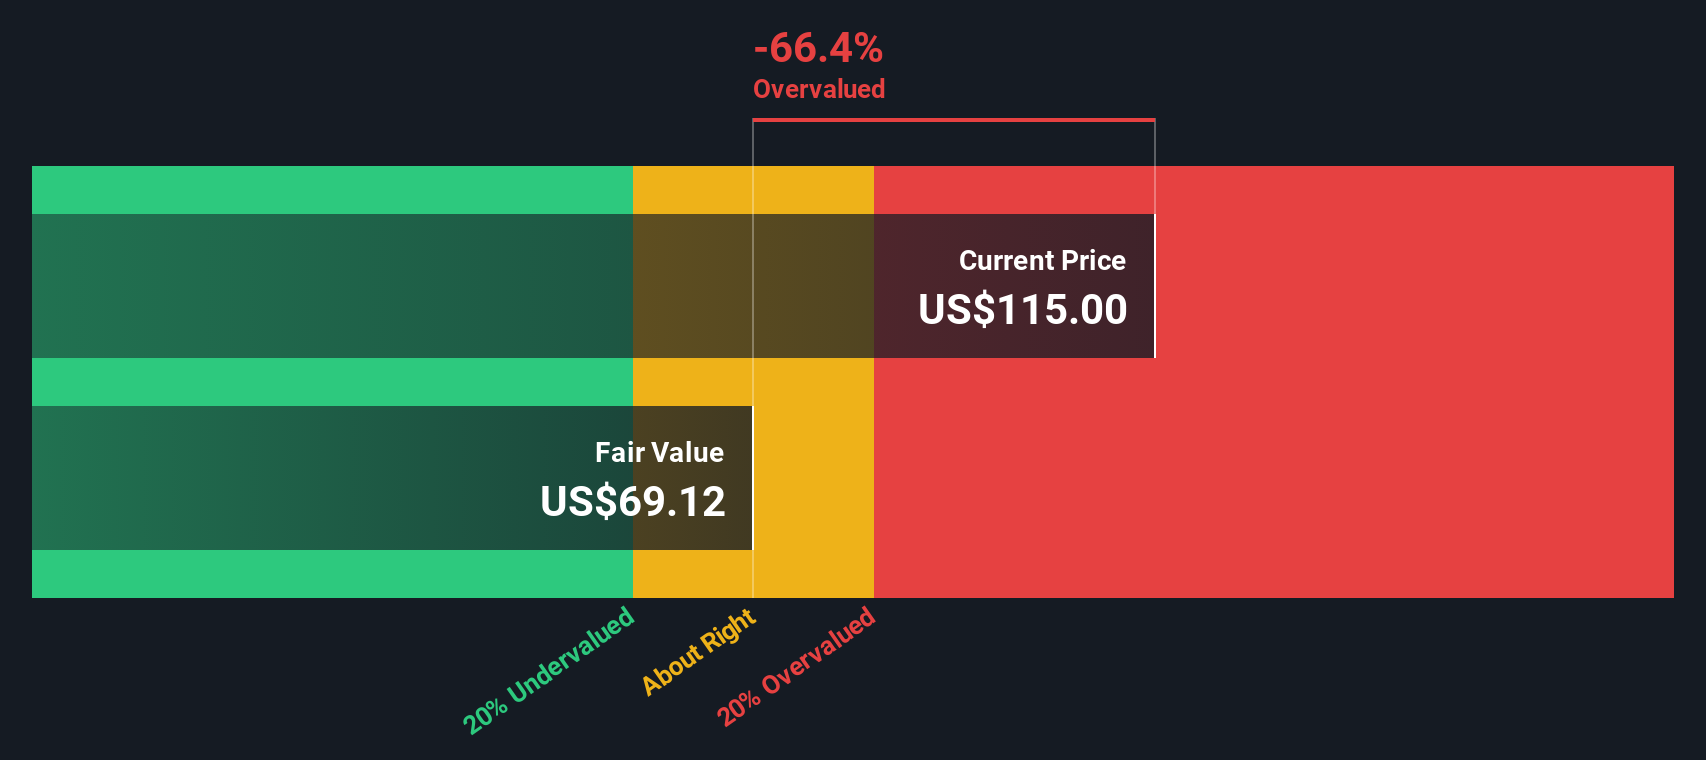
- If you are wondering whether Stifel Financial at US$130.88 is offering fair value or a margin of safety, you are not alone.
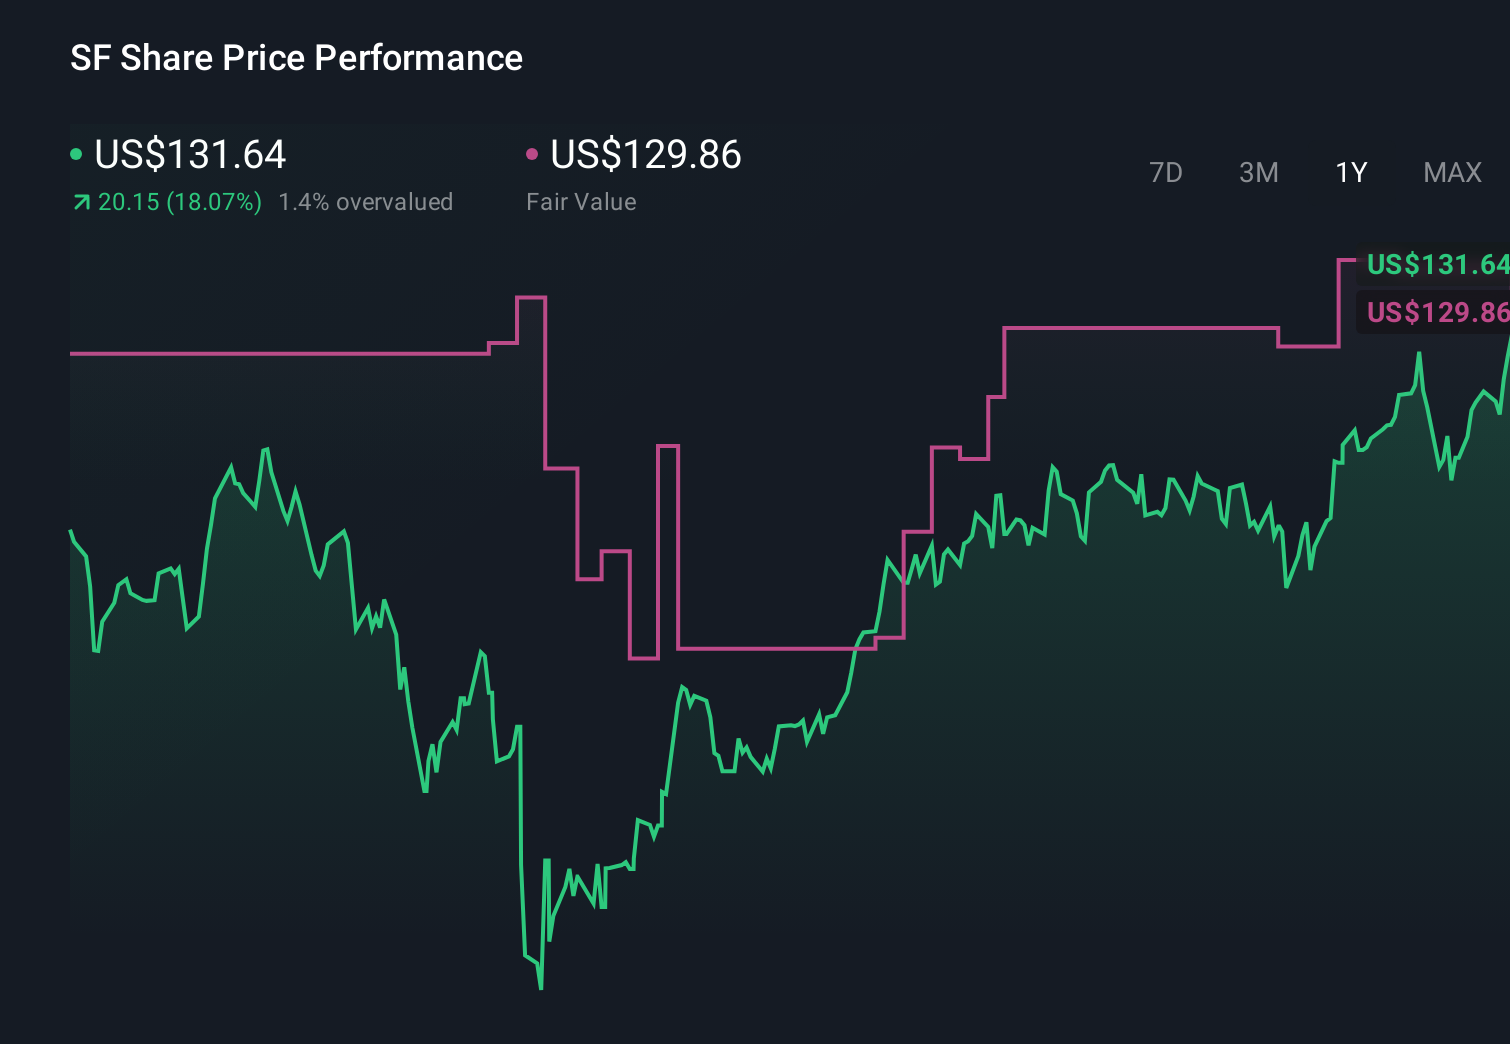
- The stock has returned 0.5% over the last 7 days, 1.9% over the past month, 2.0% year to date, 15.8% over 1 year, 109.5% over 3 years and 173.8% over 5 years. This naturally raises questions about what is already priced in and what might still be on the table.
- Recent news coverage around Stifel Financial has focused on its position as a diversified financial services firm and how it fits into broader sector themes, giving investors more context for these returns. This backdrop has kept attention on whether the current share price lines up with the company’s fundamentals.
- On our 6 point valuation check, Stifel Financial scores 2 out of 6 for being undervalued, giving it a value score of 2/6. Next we look at how different valuation approaches frame that score, before finishing with a way to assess value that goes beyond the usual ratios.
Stifel Financial scores just 2/6 on our valuation checks. See what other red flags we found in the full valuation breakdown.
Approach 1: Stifel Financial Excess Returns Analysis
The Excess Returns model looks at how much profit a company generates above the return that equity investors typically require, then capitalizes those extra profits into an estimated value per share.
For Stifel Financial, the starting point is a Book Value of US$49.74 per share and a Stable EPS of US$7.19 per share, based on the median return on equity over the past 5 years. The cost of equity is set at US$5.26 per share, which implies an Excess Return of US$1.93 per share. That excess is supported by an average return on equity of 11.62% and a Stable Book Value estimate of US$61.92 per share from two analyst forecasts.
When those excess returns are projected and discounted using this framework, the model arrives at an intrinsic value of about US$98.78 per share. Compared with the current share price of US$130.88, this implies the stock is around 32.5% overvalued on this measure.
Result: OVERVALUED
Our Excess Returns analysis suggests Stifel Financial may be overvalued by 32.5%. Discover 876 undervalued stocks or create your own screener to find better value opportunities.
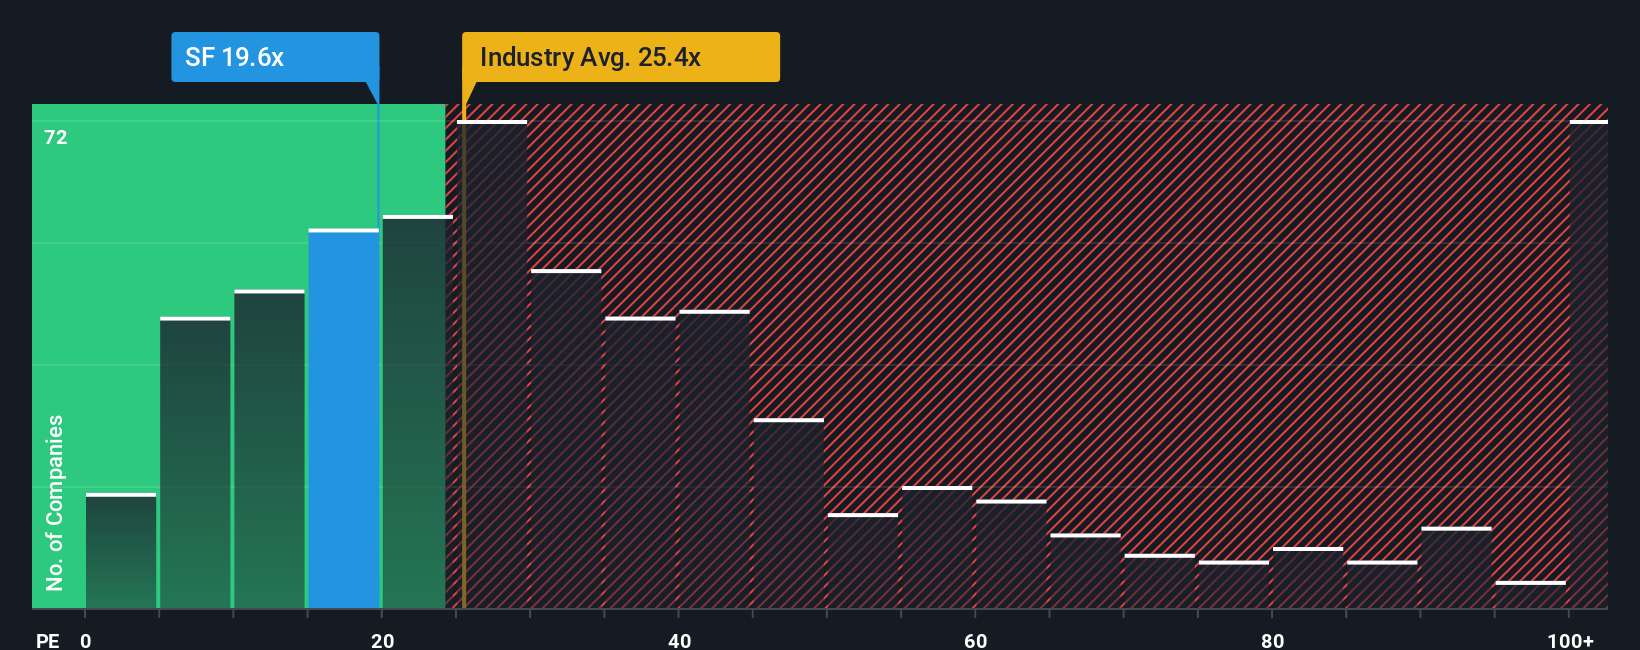
Approach 2: Stifel Financial Price vs Earnings
For a profitable company like Stifel Financial, the P/E ratio is a useful shorthand for how much you are paying for each dollar of earnings. It ties the share price directly to the business’s ability to generate profit, which is what ultimately matters for shareholders.
What counts as a “normal” P/E depends on how the market views a company’s growth potential and risk profile. Higher expected growth or lower perceived risk can justify a higher multiple, while slower growth or higher risk usually call for a lower one.
Stifel Financial currently trades on a P/E of 21.28x. That sits below the Capital Markets industry average of 25.89x and slightly below the peer group average of 22.53x. Simply Wall St’s Fair Ratio for Stifel Financial is 16.31x. This is a proprietary estimate of what the P/E might be, given factors such as earnings growth, industry, profit margins, market cap and company specific risks.
The Fair Ratio goes a step further than a simple peer or industry comparison because it adjusts for these company specific features rather than assuming one size fits all. Comparing 21.28x to the Fair Ratio of 16.31x suggests the shares are pricing in more than the model implies.
Result: OVERVALUED
P/E ratios tell one story, but what if the real opportunity lies elsewhere? Discover 1427 companies where insiders are betting big on explosive growth.
Upgrade Your Decision Making: Choose your Stifel Financial Narrative
Earlier we mentioned that there is an even better way to understand valuation, so let us introduce you to Narratives. Narratives let you attach a clear story to your numbers, such as your view of Stifel Financial’s fair value and your expectations for its future revenue, earnings and margins.
A Narrative ties three pieces together: the company story you believe, the forecast that follows from that story, and the fair value that results from those assumptions. This helps you see exactly how your view translates into a price.
On Simply Wall St, Narratives sit inside the Community page. You can quickly set or adjust your assumptions, see an updated fair value and compare it to the current share price to help you decide whether to wait, add or trim.
Because Narratives refresh when new information, such as earnings or news, is added, your fair value view of Stifel Financial stays current. You can see, for example, one investor pricing it well below US$98.78 while another prices it well above US$130.88 based on different expectations for its future.
Do you think there's more to the story for Stifel Financial? Head over to our Community to see what others are saying!
This article by Simply Wall St is general in nature. We provide commentary based on historical data and analyst forecasts only using an unbiased methodology and our articles are not intended to be financial advice. It does not constitute a recommendation to buy or sell any stock, and does not take account of your objectives, or your financial situation. We aim to bring you long-term focused analysis driven by fundamental data. Note that our analysis may not factor in the latest price-sensitive company announcements or qualitative material. Simply Wall St has no position in any stocks mentioned.