Is It Too Late To Consider StoneX Group (SNEX) After Its Strong Recent Share Price Run?
StoneX Group Inc. SNEX | 0.00 |
- Wondering whether StoneX Group stock still offers value after its strong run, or if you might be late to the party? This article breaks down what the current price could mean for you.
- At a recent close of US$106.39, the stock shows returns of 2.6% over 7 days, 24.3% over 30 days, 63.9% year to date and 69.5% over 1 year, with a very large 5 year return of 436.3%.
- Recent news coverage has focused on StoneX Group's role as a global financial services company and its position in capital markets. This helps frame how investors think about its growth runway and risk profile. Media commentary has also highlighted the stock's long term performance, prompting fresh debate about whether the current price still reflects its fundamentals.
- Despite this share price performance, the company currently records a valuation score of 1 out of 6. The next sections will compare what different valuation methods say about the stock, before finishing with a more holistic way to think about valuation that many investors overlook.
StoneX Group scores just 1/6 on our valuation checks. See what other red flags we found in the full valuation breakdown.
Approach 1: StoneX Group Excess Returns Analysis
The Excess Returns model looks at how much profit a company generates above the return that equity investors typically require, then capitalises those extra profits into an estimated per share value.
For StoneX Group, the model uses a Book Value of US$32.12 per share and a Stable EPS of US$3.39 per share, based on the median return on equity from the past 5 years. The implied Cost of Equity is US$2.80 per share, which leaves an Excess Return of US$0.59 per share. That excess is supported by an Average Return on Equity of 15.08% and a Stable Book Value of US$22.51 per share, taken from the median book value over the past 5 years.
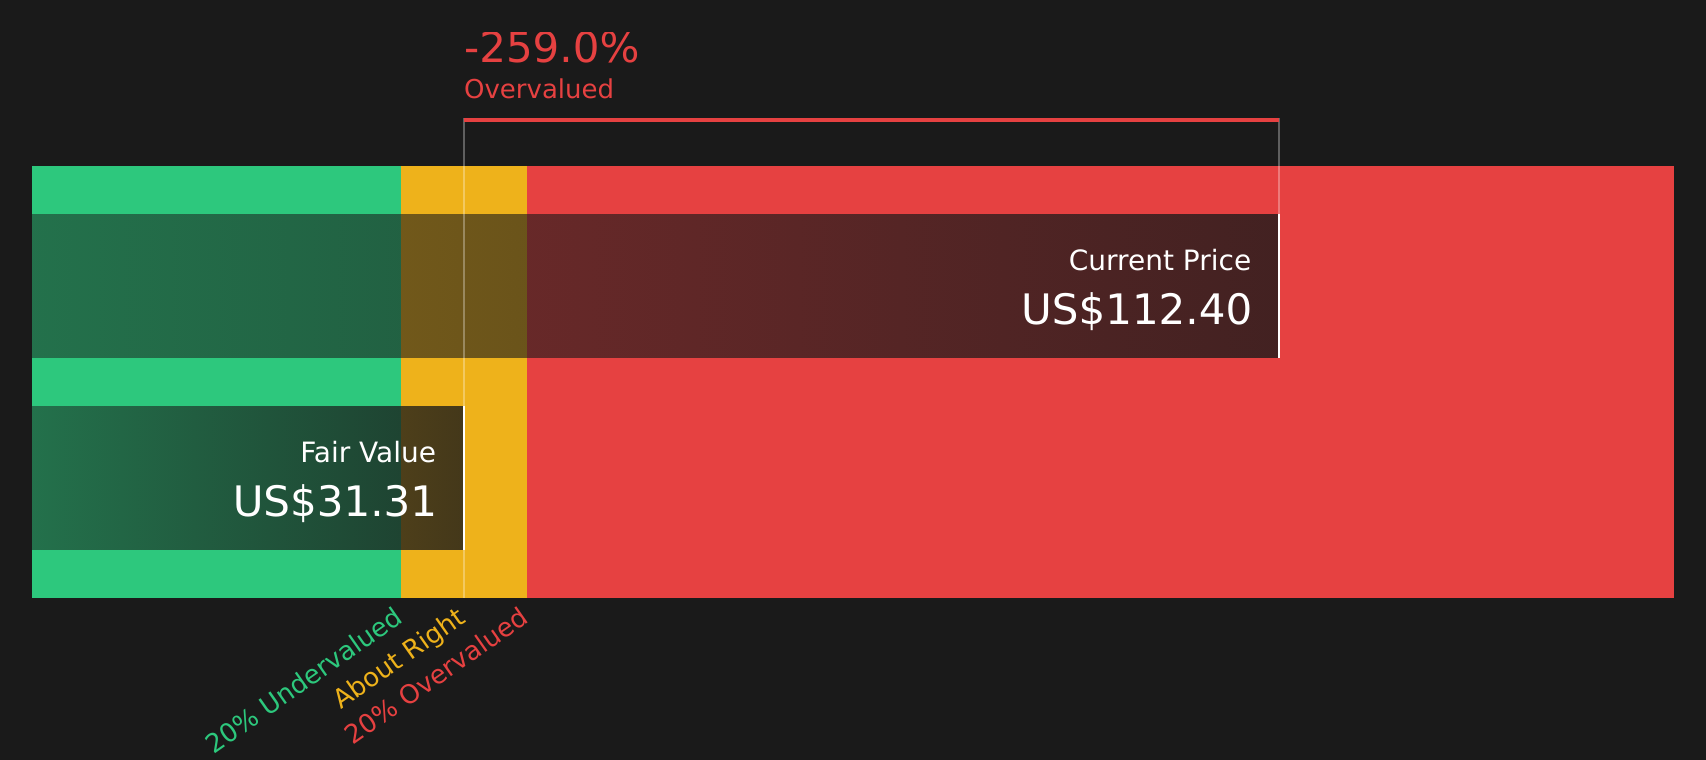
Combining these inputs, the Excess Returns model arrives at an estimated intrinsic value of about US$29.12 per share. Compared with the recent share price of US$106.39, this framework suggests the stock is very heavily overvalued, with an implied overvaluation of about 265.4%.
Result: OVERVALUED
Our Excess Returns analysis suggests StoneX Group may be overvalued by 265.4%. Discover 44 high quality undervalued stocks or create your own screener to find better value opportunities.
Approach 2: StoneX Group Price vs Earnings
For consistently profitable companies, the P/E ratio is a useful shorthand for how much investors are paying for each dollar of earnings. It links directly to what the business is currently earning, which many investors find easier to relate to than cash flow models.
A higher P/E can reflect stronger growth expectations or a lower perceived risk, while a lower P/E can point to more modest growth expectations or higher perceived risk. So the question is not whether a P/E is high or low in isolation, but whether it fits the business and its risk profile.
StoneX Group currently trades on a P/E of 24.09x. This sits below the broader Capital Markets industry average of 42.83x, but above the peer group average of 16.73x. Simply Wall St also calculates a Fair Ratio of 15.92x for StoneX Group. This Fair Ratio is designed to be more tailored than a simple peer or industry comparison, because it factors in elements such as earnings growth characteristics, profit margins, the company’s industry and market cap, as well as its risk profile.
Comparing the current P/E of 24.09x with the Fair Ratio of 15.92x suggests the stock trades above this customised benchmark.
Result: OVERVALUED

P/E ratios tell one story, but what if the real opportunity lies elsewhere? Start investing in legacies, not executives. Discover our 19 top founder-led companies.
Upgrade Your Decision Making: Choose your StoneX Group Narrative
Earlier it was mentioned that there is an even better way to understand valuation, so this is where Narratives come in. A Narrative is simply your story about a company, written in numbers, where you set your own view of fair value and your expectations for future revenue, earnings and margins. On Simply Wall St, within the Community page used by millions of investors, Narratives link that story to a financial forecast and then to an estimated fair value for the stock in a straightforward way. This helps you compare your Fair Value to the current Price to decide whether the stock looks attractive or expensive based on your own assumptions, not just broad market ratios. Narratives also update automatically when new information such as earnings or major news is added to the platform, so your view stays aligned with the latest data. For StoneX Group, one investor might build a Narrative with more cautious revenue and margin estimates that lead to a much lower fair value, while another might use more optimistic assumptions and reach a much higher fair value for the same stock.
Do you think there's more to the story for StoneX Group? Head over to our Community to see what others are saying!

This article by Simply Wall St is general in nature. We provide commentary based on historical data and analyst forecasts only using an unbiased methodology and our articles are not intended to be financial advice. It does not constitute a recommendation to buy or sell any stock, and does not take account of your objectives, or your financial situation. We aim to bring you long-term focused analysis driven by fundamental data. Note that our analysis may not factor in the latest price-sensitive company announcements or qualitative material. Simply Wall St has no position in any stocks mentioned.