Is It Too Late To Consider Thermon Group Holdings (THR) After Its 84% One-Year Surge?
Thermon Group Holdings, Inc. THR | 52.08 | +0.58% |
- If you are wondering whether Thermon Group Holdings at about US$48.77 is still reasonably priced, or if the recent enthusiasm has already been factored in, this article walks through what the current valuation might be telling you.
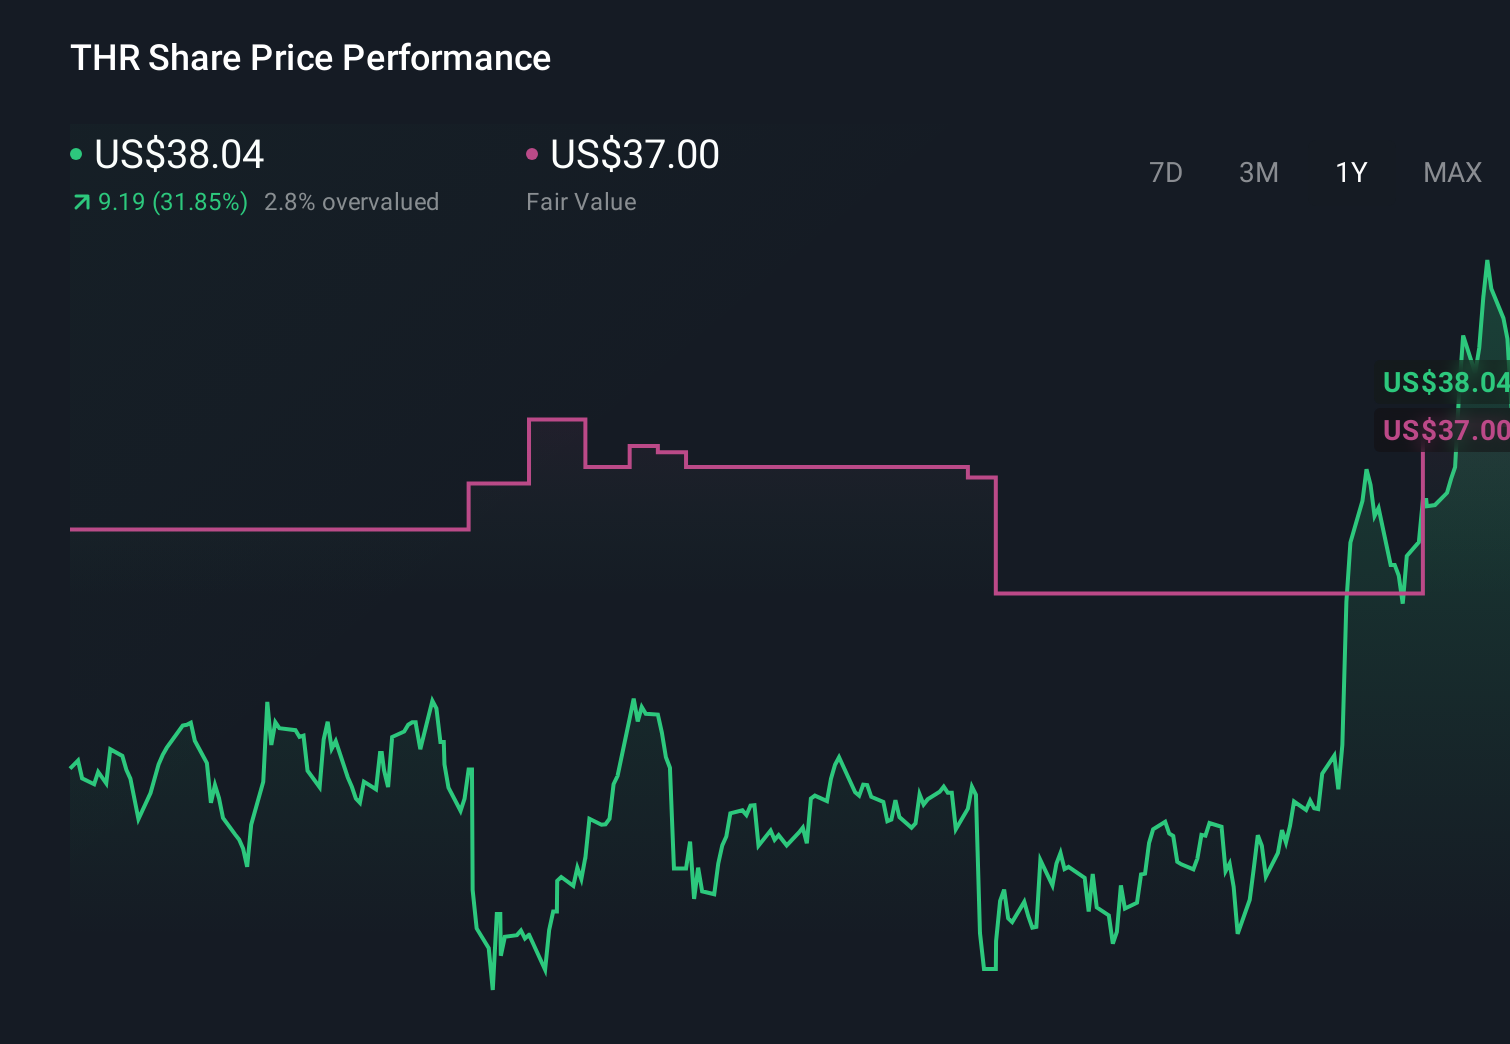
- The stock has recently seen returns of 7.0% over the last 7 days, 26.8% over 30 days, 29.6% year to date and 83.9% over the past year, with multi year returns of 83.1% over 3 years and 200.3% over 5 years.
- These moves have come alongside ongoing interest in Thermon Group Holdings as investors reassess how it fits into the broader capital goods space, including its role in industrial heating and process maintenance solutions. This context matters because changes in expectations around long term demand and project activity can influence how the market thinks about what the shares are worth.
- On our checks, Thermon Group Holdings currently scores 2 out of 6 for potential undervaluation. Next, we will look at what different valuation approaches say about that score, and conclude with a more rounded way to judge value at the end of the article.
Thermon Group Holdings scores just 2/6 on our valuation checks. See what other red flags we found in the full valuation breakdown.
Approach 1: Thermon Group Holdings Discounted Cash Flow (DCF) Analysis
A Discounted Cash Flow, or DCF, model estimates what a business could be worth today by projecting its future cash flows and then discounting those back to a single present value figure.
For Thermon Group Holdings, the model used is a 2 Stage Free Cash Flow to Equity approach based on cash flow projections. The latest twelve month free cash flow is about $48.84 million, and analysts provide explicit forecasts out to 2028, where free cash flow is projected at $66.70 million. Beyond that, Simply Wall St extrapolates free cash flow out to 2035 using a series of annual projections, each discounted back to today to reflect risk and the time value of money.
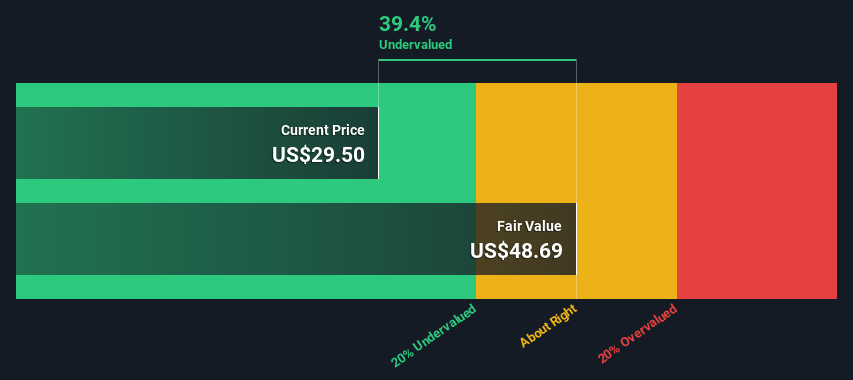
Bringing all of these discounted cash flows together gives an estimated intrinsic value of about $34.71 per share. Compared with a current share price of roughly $48.77, the DCF suggests the stock is about 40.5% above this intrinsic estimate, which indicates it is overvalued on this model.
Result: OVERVALUED
Our Discounted Cash Flow (DCF) analysis suggests Thermon Group Holdings may be overvalued by 40.5%. Discover 55 high quality undervalued stocks or create your own screener to find better value opportunities.
Approach 2: Thermon Group Holdings Price vs Earnings
For profitable companies, the P/E ratio is a useful way to think about value because it links what you pay for each share directly to the earnings that business is currently generating.
What counts as a normal or fair P/E often reflects how the market views a company’s growth prospects and risk profile. Higher growth or lower perceived risk can support a higher multiple, while slower growth or higher uncertainty usually points to a lower one.
Thermon Group Holdings is trading on a P/E of about 27.1x. That sits below the Electrical industry average of roughly 34.7x, and also below the peer group average of around 41.3x. Simply Wall St’s Fair Ratio for Thermon Group Holdings is 20.2x, which is its estimate of an appropriate P/E given factors such as earnings growth, industry, profit margins, market cap and company specific risks.
This Fair Ratio is more tailored than a simple comparison with peers or the industry because it attempts to adjust for the company’s own characteristics rather than assuming all firms should trade on similar multiples.
On this basis, Thermon Group Holdings P/E of 27.1x is above the Fair Ratio of 20.2x. This points to the shares being overvalued on this measure.
Result: OVERVALUED

P/E ratios tell one story, but what if the real opportunity lies elsewhere? Start investing in legacies, not executives. Discover our 22 top founder-led companies.
Upgrade Your Decision Making: Choose your Thermon Group Holdings Narrative
Earlier we mentioned that there is an even better way to understand valuation, so let us introduce you to Narratives, which are simply your story about a company linked directly to your own numbers for fair value, future revenue, earnings and margins.
Instead of only relying on models like DCF or P/E comparisons, a Narrative on Simply Wall St connects three pieces: the business story you believe, the financial forecast that matches that story, and the fair value that falls out of those assumptions.
You can create and explore Narratives on the Simply Wall St Community page, where millions of investors are already doing this, compare your fair value for Thermon Group Holdings with the current share price, and see how that might guide when you choose to buy, hold or sell.
Because Narratives on the platform update automatically when fresh information such as news, filings or earnings is added, your story and valuation stay current without extra effort.
For example, one Thermon Group Holdings Narrative might assume a relatively high fair value with stronger future margins, while another might use more cautious forecasts and a lower fair value, giving you a clear view of how different perspectives translate into different price expectations.
Do you think there's more to the story for Thermon Group Holdings? Head over to our Community to see what others are saying!
This article by Simply Wall St is general in nature. We provide commentary based on historical data and analyst forecasts only using an unbiased methodology and our articles are not intended to be financial advice. It does not constitute a recommendation to buy or sell any stock, and does not take account of your objectives, or your financial situation. We aim to bring you long-term focused analysis driven by fundamental data. Note that our analysis may not factor in the latest price-sensitive company announcements or qualitative material. Simply Wall St has no position in any stocks mentioned.