

Is It Too Late To Consider VeriSign (VRSN) After Its Recent Share Price Climb?
VeriSign, Inc. VRSN | 0.00 |
- Wondering if VeriSign at around US$296 per share is still a solid deal or already pricing in most of its strengths? This article breaks down what the current tag might be implying about future expectations.
- The stock has been choppy in the short term, with a decline of 3.2% over the last 7 days. However, it is up 9.5% over 30 days, 23.1% year to date, 11.6% over 1 year, 34.6% over 3 years, and 39.2% over 5 years.
- Recent headlines around VeriSign have focused on its role in internet infrastructure and the market's changing expectations for established software and services providers. This helps frame how investors are thinking about its future cash generation and resilience. These themes often influence how much of a premium or discount the market is willing to put on dependable, subscription like revenue models.
- On Simply Wall St's valuation checks, VeriSign scores 1 out of 6. The rest of this article will walk through what different valuation methods say about that score, and then finish with a broader way to think about whether the current price really lines up with your expectations for the business.
VeriSign scores just 1/6 on our valuation checks. See what other red flags we found in the full valuation breakdown.
Approach 1: VeriSign Discounted Cash Flow (DCF) Analysis
A Discounted Cash Flow model takes estimates of the cash a company could generate in the future, then discounts those cash flows back to today to arrive at an estimate of what the business might be worth right now.
For VeriSign, the model uses a 2 Stage Free Cash Flow to Equity approach based on cash flow projections. The latest twelve month free cash flow is about $1.04b. Analysts provide explicit forecasts out to 2027, with Simply Wall St extending the projections further. By 2035, the model is using an extrapolated free cash flow figure of $1.41b, with a full set of annual estimates in between.
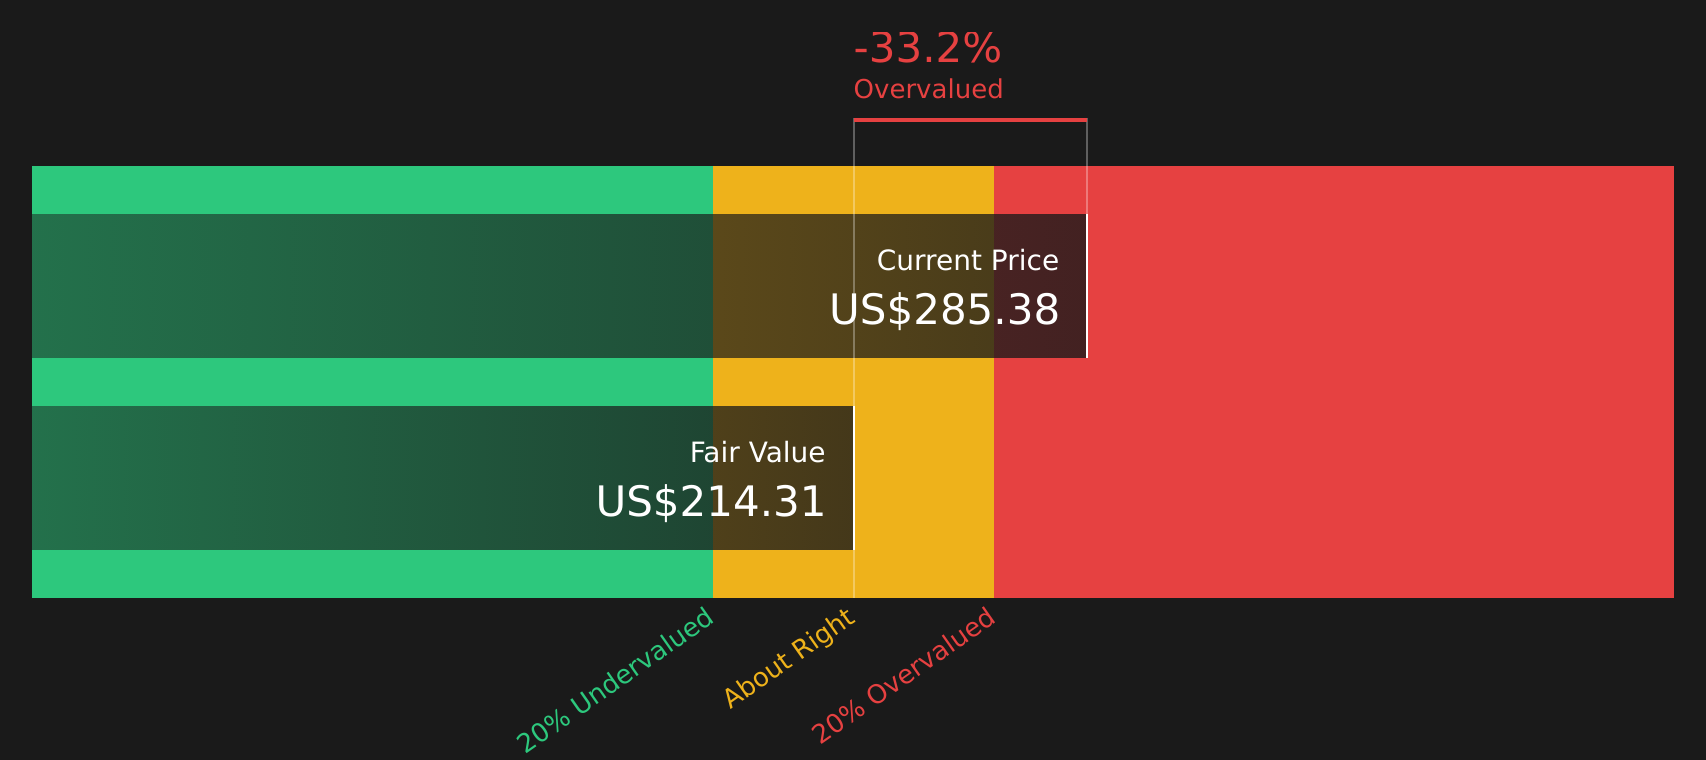
After discounting those projected cash flows, the DCF model arrives at an estimated intrinsic value of about $216.17 per share. Compared with a recent share price around $296, the calculation suggests VeriSign is roughly 37.0% above this modelled value, which points to the stock trading on a premium relative to these cash flow assumptions.
Result: OVERVALUED
Our Discounted Cash Flow (DCF) analysis suggests VeriSign may be overvalued by 37.0%. Discover 46 high quality undervalued stocks or create your own screener to find better value opportunities.
Approach 2: VeriSign Price vs Earnings
For profitable companies, the P/E ratio is a useful way to see how much investors are paying for each dollar of earnings. It ties the share price directly to the bottom line, which is typically more stable than revenue or book value for mature, profitable businesses.
What counts as a “normal” P/E often reflects two things: how fast earnings might grow and how much risk investors see in those earnings. Higher expected growth or lower perceived risk can justify a higher P/E, while lower growth or higher risk usually points to a lower multiple.
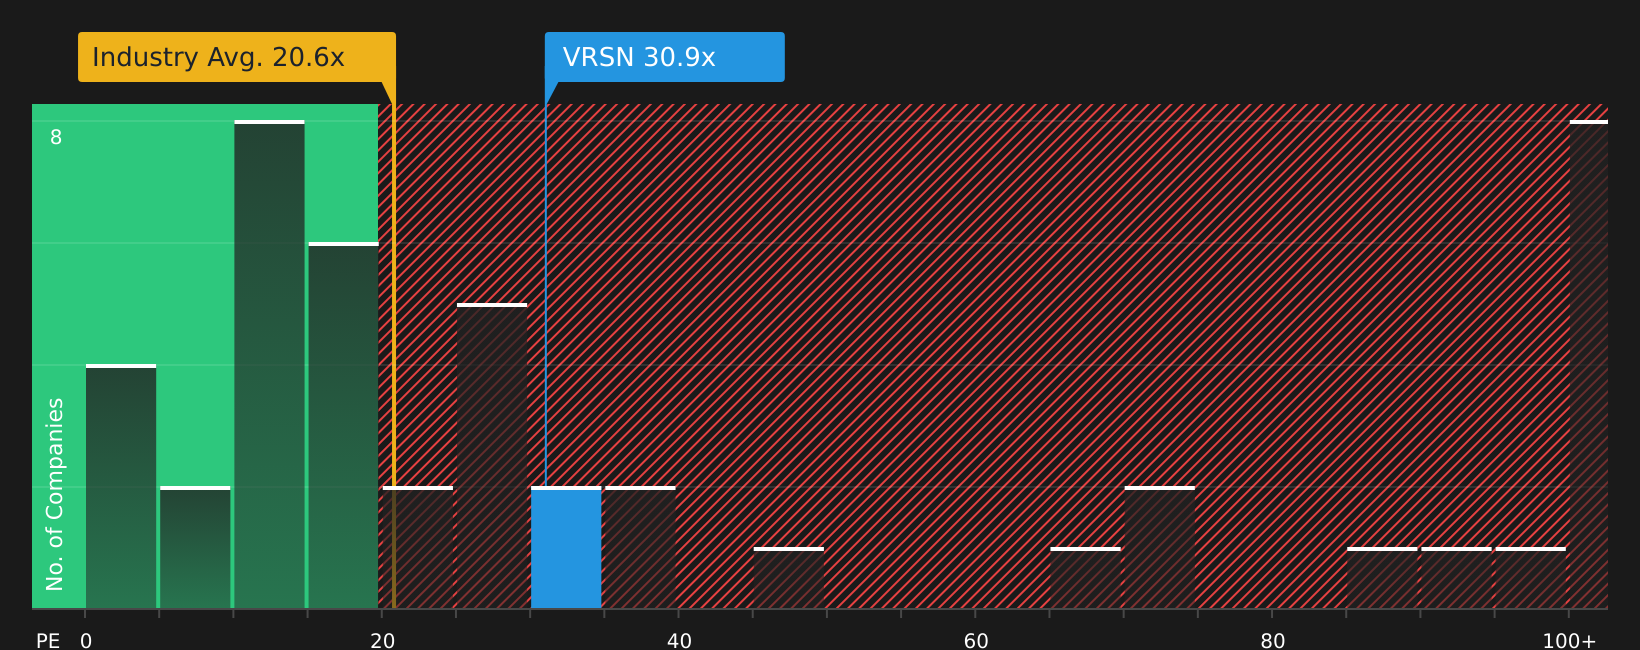
VeriSign currently trades on a P/E of 32.09x. That sits above the broader IT industry average of 20.50x and below the peer group average of 49.63x. Simply Wall St’s proprietary Fair Ratio for VeriSign is 23.22x, which is built from company specific factors such as earnings growth estimates, profit margins, industry, market cap and risk profile. This Fair Ratio aims to be more tailored than a simple peer or industry comparison because it adjusts for the company’s own characteristics rather than assuming averages are a good fit.
Comparing the current 32.09x P/E to the 23.22x Fair Ratio suggests the stock is trading above what this framework would consider a fair multiple.
Result: OVERVALUED
P/E ratios tell one story, but what if the real opportunity lies elsewhere? Start investing in legacies, not executives. Discover our 21 top founder-led companies.
Upgrade Your Decision Making: Choose your VeriSign Narrative
Earlier it was mentioned that there is an even better way to understand valuation. Meet Narratives, a simple tool on Simply Wall St’s Community page that lets you set out your own story for VeriSign, link that story to explicit forecasts for revenue, earnings and margins, and turn it into a Fair Value you can compare with the current share price to judge whether the stock looks attractive or expensive for you.
Each Narrative ties together what you think matters most. This can range from concerns about legal and cultural risks that might point to a Fair Value closer to US$165, through to a more cautious stance around growth that lines up near US$265, or a more optimistic view that supports a Fair Value around US$305. The Narrative then keeps that view updated automatically when new earnings, guidance or news are added, so your decision to hold, add or reduce is always grounded in a clear, quantified thesis rather than a single static metric.
For VeriSign, however, we will make it really easy for you with previews of two leading VeriSign Narratives:
Fair Value: US$305.00
Implied discount to this Fair Value at US$296.14, based on this narrative, is about 2.9%.
Revenue growth assumption: 7.64%
- Assumes global domain registrations and renewals, especially in Asia Pacific and emerging markets, support higher revenue and customer growth than current consensus.
- Relies on renewed .com and .net registry agreements, strong infrastructure and demand for secure digital services to support pricing power and long term free cash flow.
- Accepts concentrated exposure to core registry contracts and regulatory risk, but treats these as manageable in exchange for higher earnings, buybacks and a premium P/E multiple.
Fair Value: US$165.00
Implied premium to this Fair Value at US$296.14, based on this narrative, is about 79.5%.
Revenue growth assumption: 2.46%
- Flags culture and management issues, with reported policy breaches and weak accountability, as material governance and compliance risks.
- Highlights potential legal and regulatory exposure, including possible litigation and closer scrutiny of .com and .net contracts, which could affect renewal outcomes.
- Views VeriSign as heavily dependent on a single service, with limited diversification and slower growth in a more competitive domain market, leading to a lower Fair Value of US$165.
Both narratives use the same underlying business, contracts and disclosures, but arrive at very different Fair Values based on how each author weighs growth, concentration risk, legal exposure and future market expectations. If you want to test which version is closer to your own view on VeriSign, you can read the full stories and then adjust the assumptions to match your expectations for contracts, margins and growth using Narratives on Simply Wall St, and see how that shifts the Fair Value you are comfortable with.
Do you think there's more to the story for VeriSign? Head over to our Community to see what others are saying!

This article by Simply Wall St is general in nature. We provide commentary based on historical data and analyst forecasts only using an unbiased methodology and our articles are not intended to be financial advice. It does not constitute a recommendation to buy or sell any stock, and does not take account of your objectives, or your financial situation. We aim to bring you long-term focused analysis driven by fundamental data. Note that our analysis may not factor in the latest price-sensitive company announcements or qualitative material. Simply Wall St has no position in any stocks mentioned.