

Is It Too Late To Consider Williams Sonoma (WSM) After Its Strong Multi Year Share Price Run
Williams-Sonoma, Inc. WSM | 0.00 |
- Investors may be wondering whether Williams-Sonoma stock still offers value after a strong run, or if most of the opportunity is already priced in.
- The stock closed at US$203.57, with returns of 5.8% over 7 days, 12.4% over 30 days, 8.4% year to date, 27.7% over 1 year and a very large 3 year return, alongside a 168.8% return over 5 years. This performance can change how the market views its risk and reward profile.
- Recent coverage has focused on how Williams-Sonoma fits into broader retail trends and how investors are reassessing established consumer brands. That context helps explain why the stock's strong multi year performance keeps attracting attention from both existing and new shareholders.
- On Simply Wall St's valuation checks, Williams-Sonoma currently scores 2 out of 6. This raises the question of how traditional metrics like P/E and DCF line up with what the market is paying today, and whether a more complete way of thinking about value might matter even more by the end of this article.
Williams-Sonoma scores just 2/6 on our valuation checks. See what other red flags we found in the full valuation breakdown.
Approach 1: Williams-Sonoma Discounted Cash Flow (DCF) Analysis
A Discounted Cash Flow, or DCF, model estimates what a stock could be worth by projecting future cash flows and discounting them back to today’s value using a required return. It is essentially asking what Williams-Sonoma’s future cash generation is worth in today’s dollars.
Williams-Sonoma’s latest twelve month Free Cash Flow (FCF) is reported at about $1.12b. Simply Wall St uses a 2 Stage Free Cash Flow to Equity model that starts with analyst estimates, then extends them further out. For example, projected FCF for 2029 is $1.44b, and the model also includes a set of extrapolated figures through 2035 that are discounted back to present value.
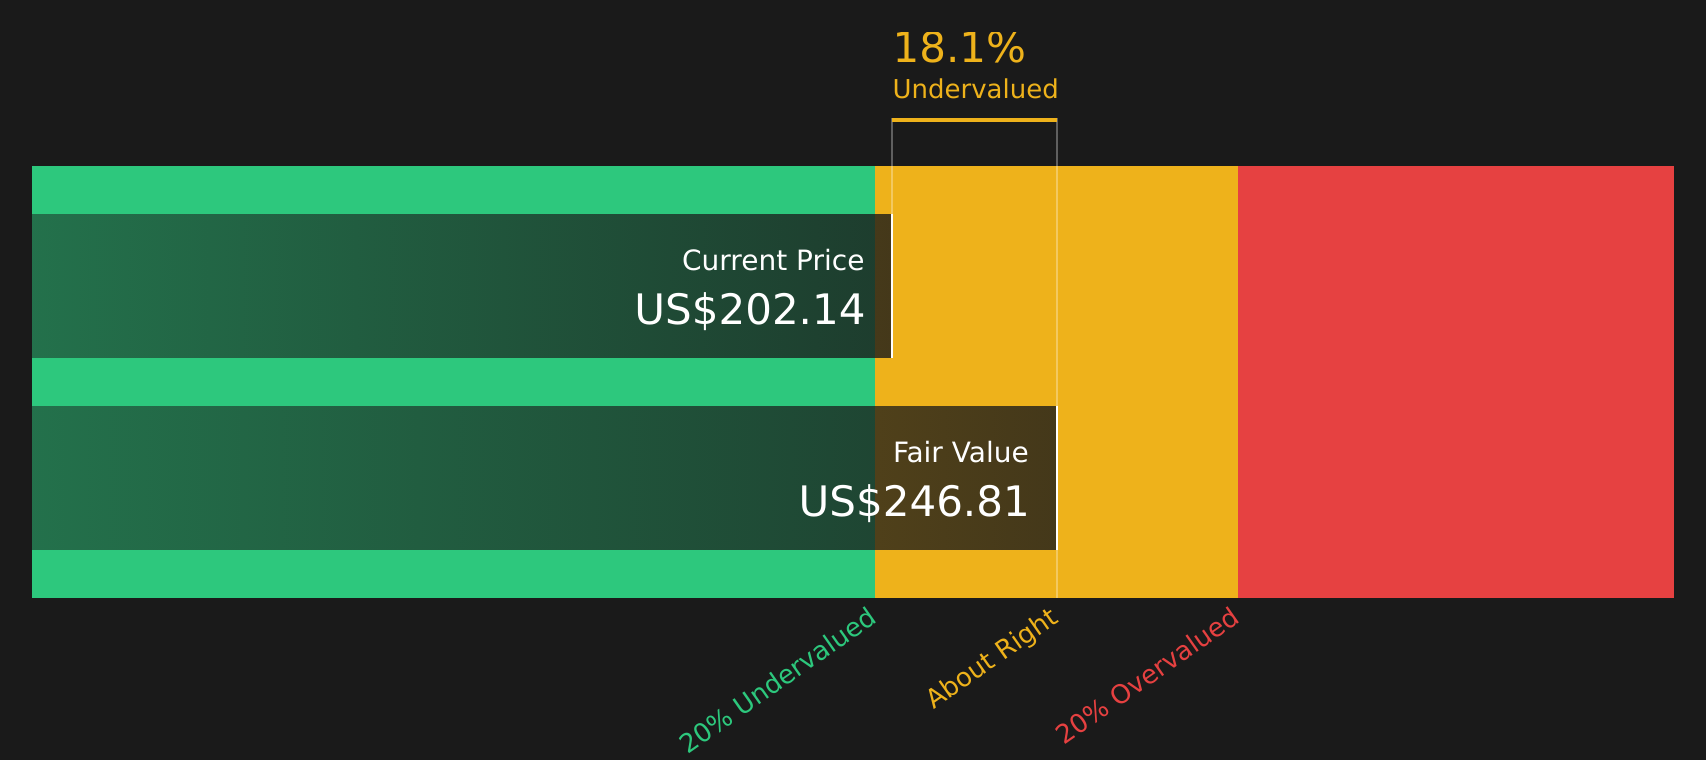
Putting those cash flows together, the model arrives at an estimated intrinsic value of $246.53 per share. Compared to the recent share price of $203.57, the DCF suggests Williams-Sonoma trades at a 17.4% discount, which in this model indicates the stock is undervalued on this cash flow view.
Result: UNDERVALUED (per this DCF model)
Our Discounted Cash Flow (DCF) analysis suggests Williams-Sonoma is undervalued by 17.4%. Track this in your watchlist or portfolio, or discover 46 more high quality undervalued stocks.
Approach 2: Williams-Sonoma Price vs Earnings
For a profitable company like Williams-Sonoma, the P/E ratio is a common way to think about value because it compares what you pay for each dollar of current earnings. Investors typically accept a higher P/E when they expect stronger growth or see the earnings stream as relatively resilient, and look for a lower P/E when there is more uncertainty or perceived risk.
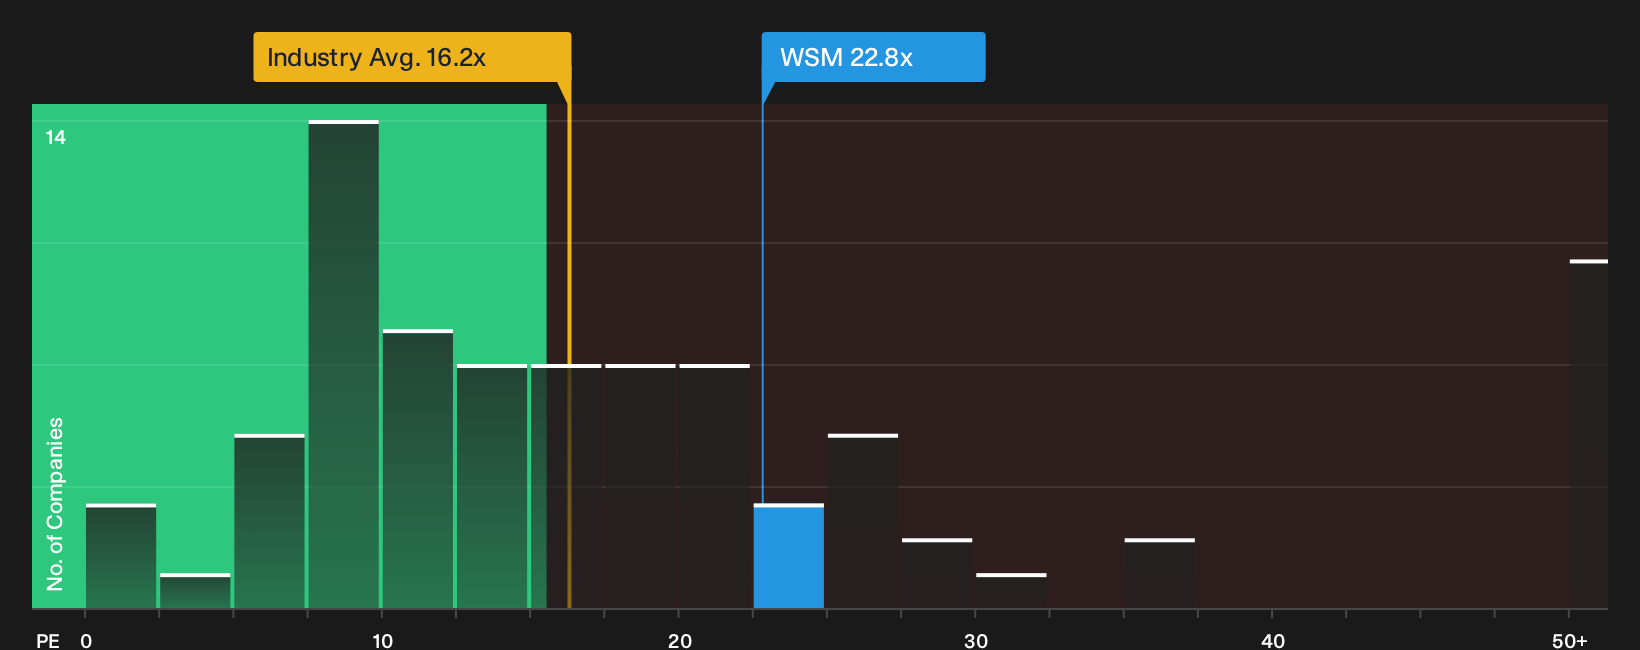
Williams-Sonoma currently trades on a P/E of 22.0x. That sits slightly above the Specialty Retail industry average of 21.5x and above the peer group average of 18.1x. Simply Wall St also calculates a proprietary “Fair Ratio” for Williams-Sonoma of 17.5x, which reflects factors such as the company’s earnings growth profile, profit margins, industry, market cap and its specific risks.
This Fair Ratio can often be more useful than a simple comparison against peers or the broad industry because those groups can include companies with very different growth, risk and profitability characteristics. Comparing Williams-Sonoma’s current P/E of 22.0x with the Fair Ratio of 17.5x suggests the stock is trading above what this framework would view as a more typical multiple for its fundamentals.
Result: OVERVALUED
P/E ratios tell one story, but what if the real opportunity lies elsewhere? Start investing in legacies, not executives. Discover our 20 top founder-led companies.
Upgrade Your Decision Making: Choose your Williams-Sonoma Narrative
Earlier it was mentioned that there is an even better way to think about valuation. This is where Narratives come in, giving you a simple story that ties your view of Williams-Sonoma to specific forecasts for revenue, earnings and margins, and then to a Fair Value that you can compare with the current share price.
On Simply Wall St, a Narrative is your own explanation of what you think is happening at a company, along with the numbers that match that view, instead of just taking a single DCF or P/E output at face value.
Each Narrative links three pieces together: the business story, the financial forecast and the resulting estimate of Fair Value. Because it lives on the Community page used by millions of investors, you can see how your view compares with others.
These Narratives are refreshed when new information such as earnings, tariff developments or brand launches is added. Your Fair Value view can therefore move as the underlying assumptions change, instead of staying frozen in time.
For Williams-Sonoma, one investor might lean toward a cautious Narrative that lines up with a Fair Value around US$161.76, while another might prefer a more optimistic Narrative closer to US$230. Comparing both to the current share price can help you decide whether the stock appears expensive, cheap or roughly in line with your expectations.
For Williams-Sonoma, however, we will make it really easy for you with previews of two leading Williams-Sonoma Narratives:
Each one lines up a clear story with specific numbers, so you can see how different assumptions about growth, margins and valuation compare with the current share price of US$203.57.
Fair Value: US$230.00
Implied discount to this Fair Value vs last close: about 11.5%.
Revenue growth used in this narrative: 5.84% a year.
- Assumes Williams-Sonoma benefits from strong e commerce and omnichannel execution, with a large share of revenue coming from digital channels and ongoing investment in personalization and supply chain efficiency.
- Builds in support from demographics and brand strength across Pottery Barn, West Elm, Rejuvenation and newer concepts, with sustainability and in house product design helping pricing power and margins.
- Arrives at a Fair Value of US$230.00 using slightly higher revenue growth, a modest uplift in profit margins and a higher future P/E multiple than the sector average, while also factoring in buybacks and an 8.49% discount rate.
Fair Value: US$161.76
Implied premium to this Fair Value vs last close: about 25.9%.
Revenue growth used in this narrative: 4.52% a year.
- Focuses on tariff exposure, macro uncertainty and modest comparable sales assumptions, which together keep a lid on expected revenue growth and pressure margins.
- Highlights that inventory tactics and working capital demands could weigh on returns if demand softens, even as AI, digital investment and international expansion offer some support.
- Arrives at a Fair Value of US$161.76 using slightly lower revenue growth, a small margin reduction and a future P/E of 18.1x, along with an 8.3% discount rate and the same share reduction assumptions.
These two narratives frame the current US$203.57 share price between a more optimistic Fair Value near US$230 and a more cautious view at about US$161.76. This allows you to consider which set of assumptions sits closer to your own expectations for Williams-Sonoma over the next few years.
To see the full context behind these numbers, including the detailed forecasts, risks and valuation work behind each scenario, See what the community is saying about Williams-Sonoma.
Do you think there's more to the story for Williams-Sonoma? Head over to our Community to see what others are saying!

This article by Simply Wall St is general in nature. We provide commentary based on historical data and analyst forecasts only using an unbiased methodology and our articles are not intended to be financial advice. It does not constitute a recommendation to buy or sell any stock, and does not take account of your objectives, or your financial situation. We aim to bring you long-term focused analysis driven by fundamental data. Note that our analysis may not factor in the latest price-sensitive company announcements or qualitative material. Simply Wall St has no position in any stocks mentioned.